Origin 中文插件列表 - 绘图(77 个)
说明
- 这是 Origin 中文插件列表中的一个部分,基于 Origin 插件数据库自动构建;
- 目录及详细说明请阅读:目录;
- 本文除已授权单位外禁止转载;
- 更新时间:2024-11-22 22:39:47
2D 专业图表
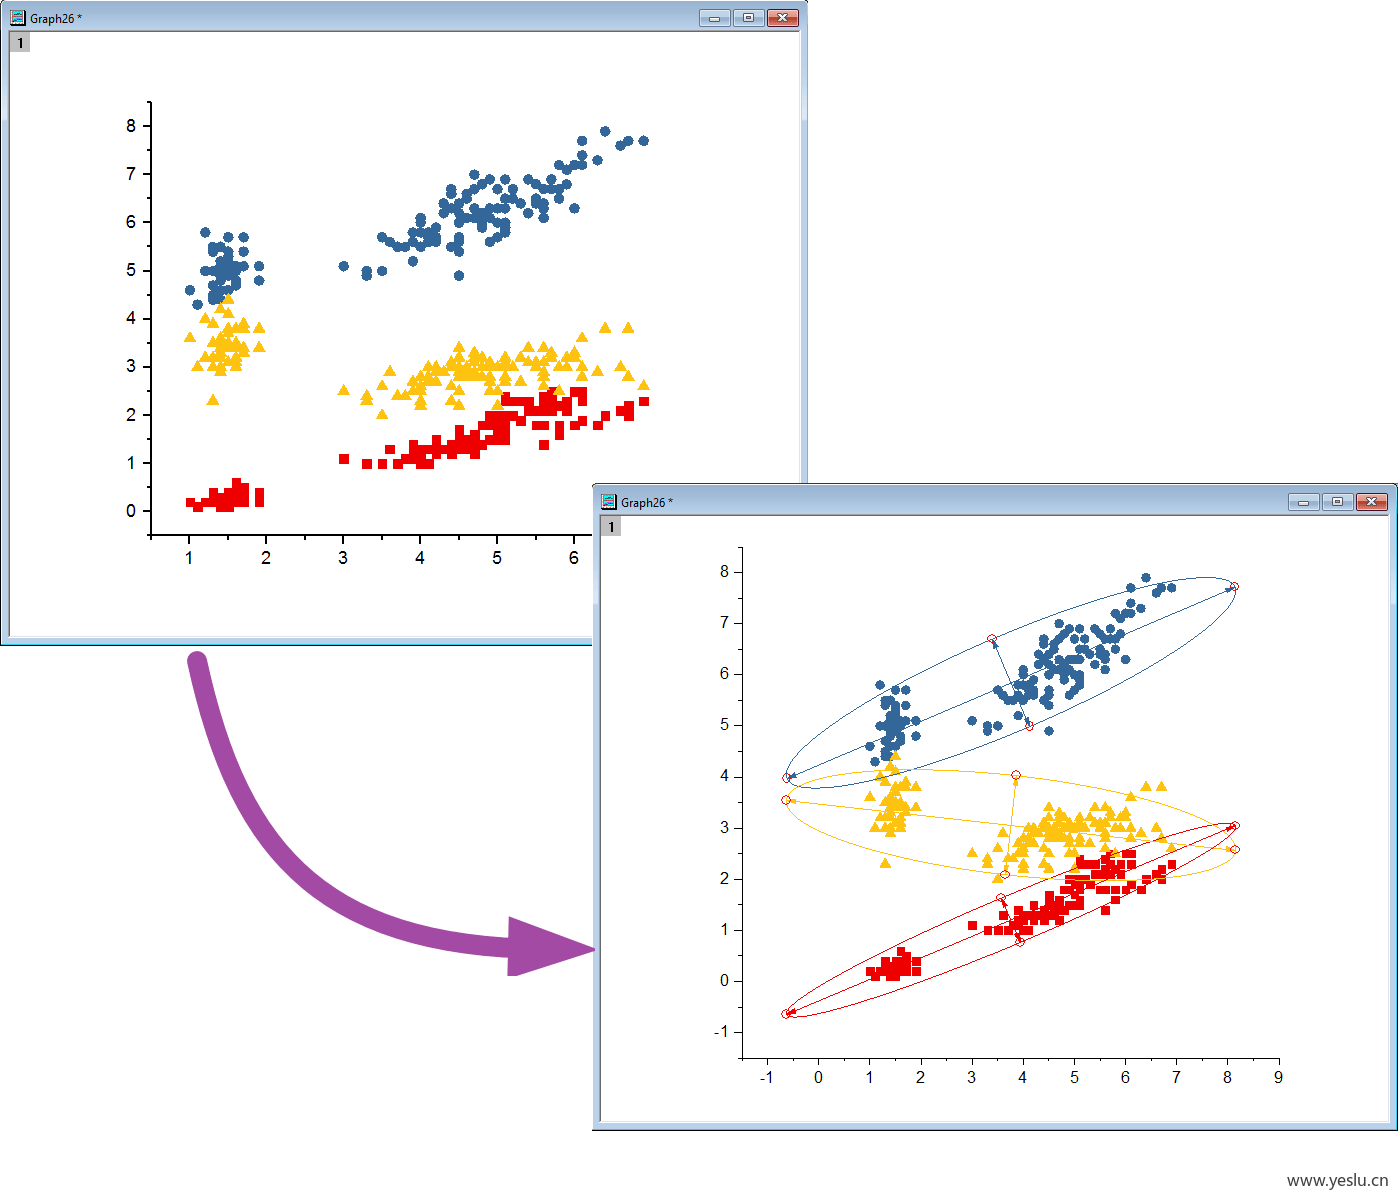
365 - 2D Confidence Ellipse
在二维散点图中添加置信椭圆
Add confidence ellipse to 2D scatter plot
- 关键词:椭圆、图表、自信、轴、2D
- Keywords: ellipse, graph, confidence, axis, 2d
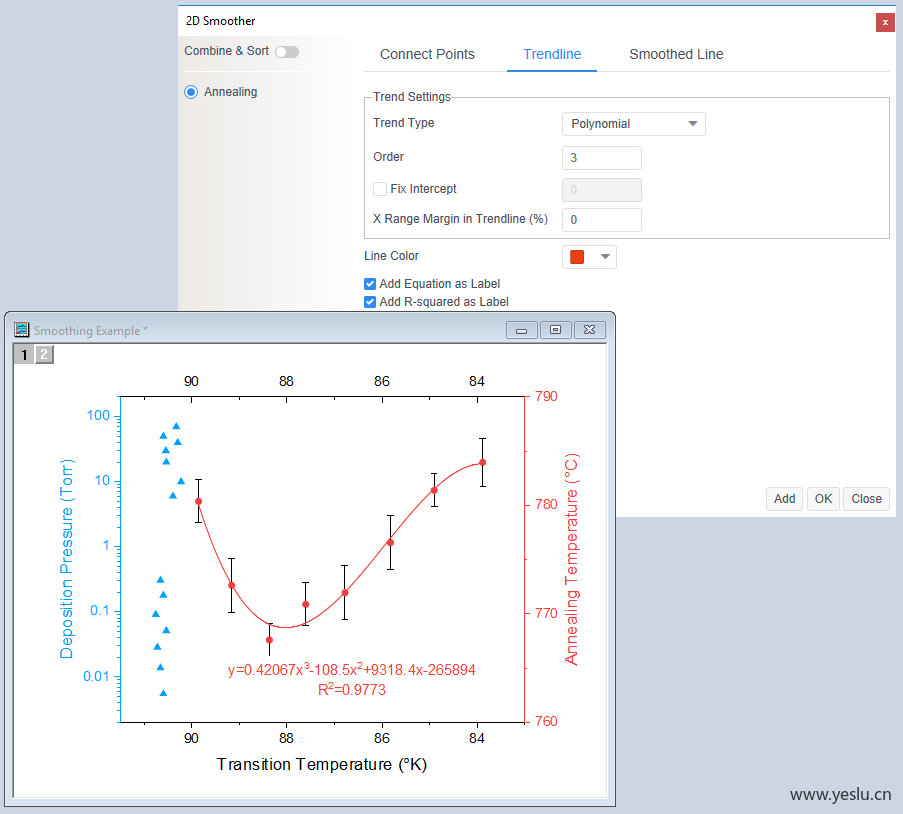
434 - 2D Smoother
执行 XY 数据图的平滑
Perform smoothing of XY data plots
- 关键词:左边、对、进去、阴谋、合身
- Keywords: left, right, ln, plots, fit
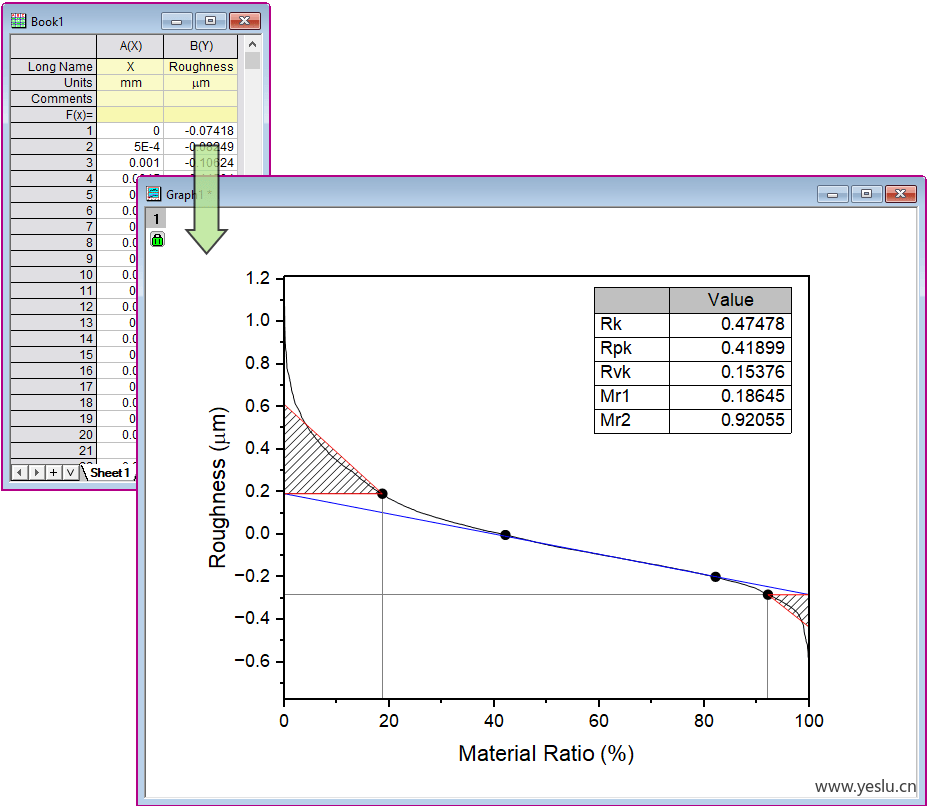
936 - Abbott-Firestone Curve
创建雅培-费尔斯通曲线并计算 Rk 系列值。
Create Abbott-Firestone curve and calculate Rk family values.
- 关键词:面积、曲线、粗暴、二、三角形
- Keywords: area, curve, roughness, two, triangle
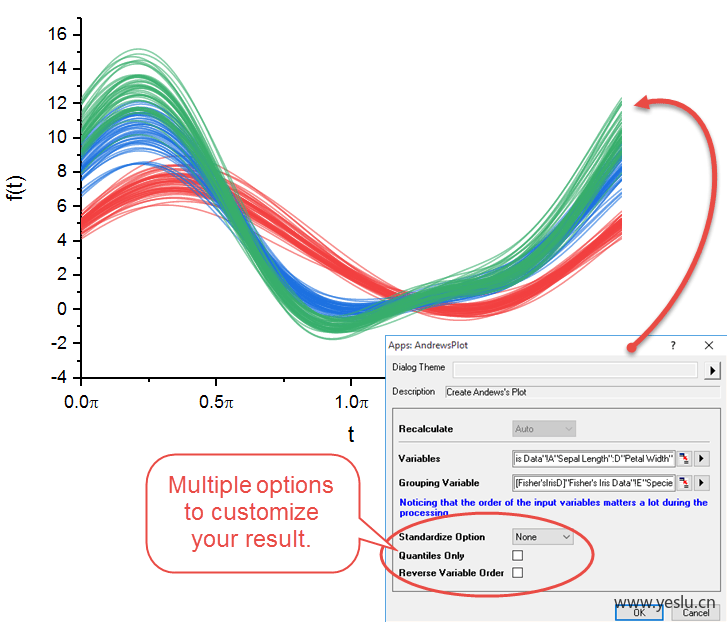
402 - Andrews Plot
创建安德鲁斯阴谋
Create Andrews Plot
- 关键词:输入、变形、变量、得分、小组
- Keywords: input, transform, variables, scores, group
446 - Chromaticity Diagram
支持 PL 数据和 L * a * b * 数据的色度图模板。
Chromaticity diagram template with support for PL data and Lab* data.
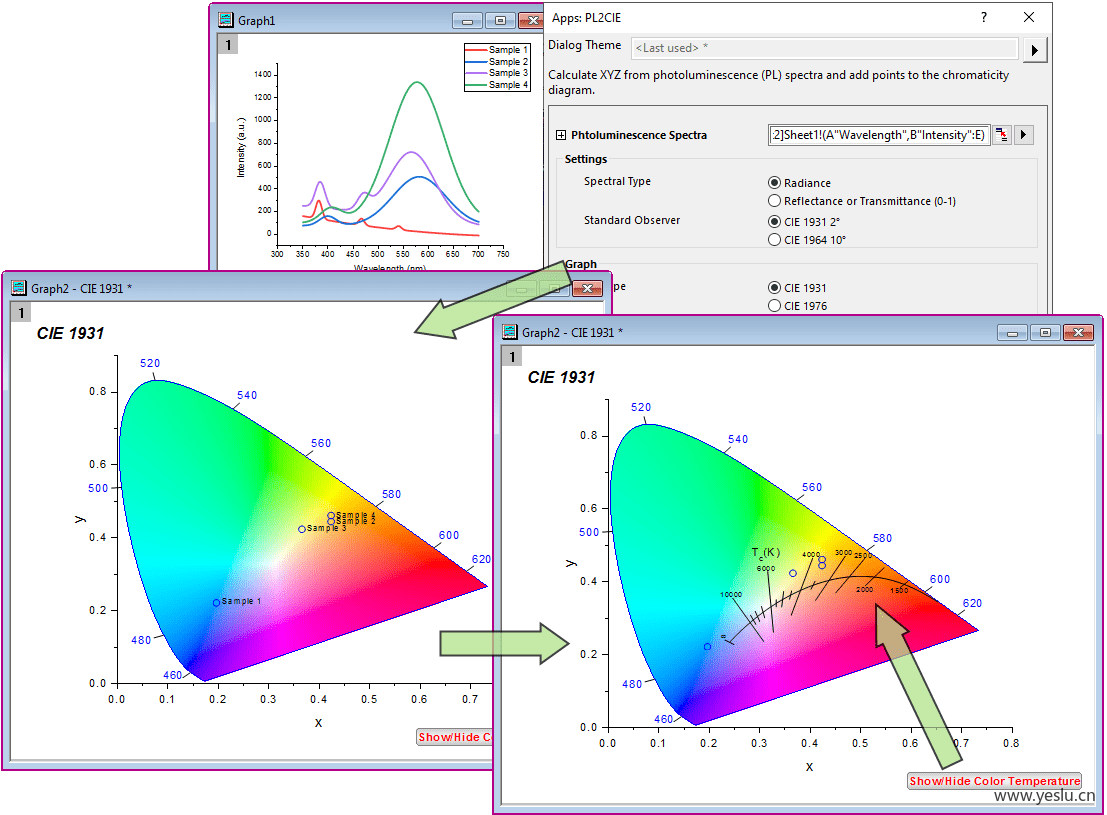
- 关键词:Lambda、酒吧、Cie、图表、图解
- Keywords: lambda, bar, cie, graph, diagram
666 - Color Spectrum Plot
创建一个由波长数据(纳米)定义的填充颜色的光谱图。
Create a spectrum plot with filled colors defined by wavelength data (nm).
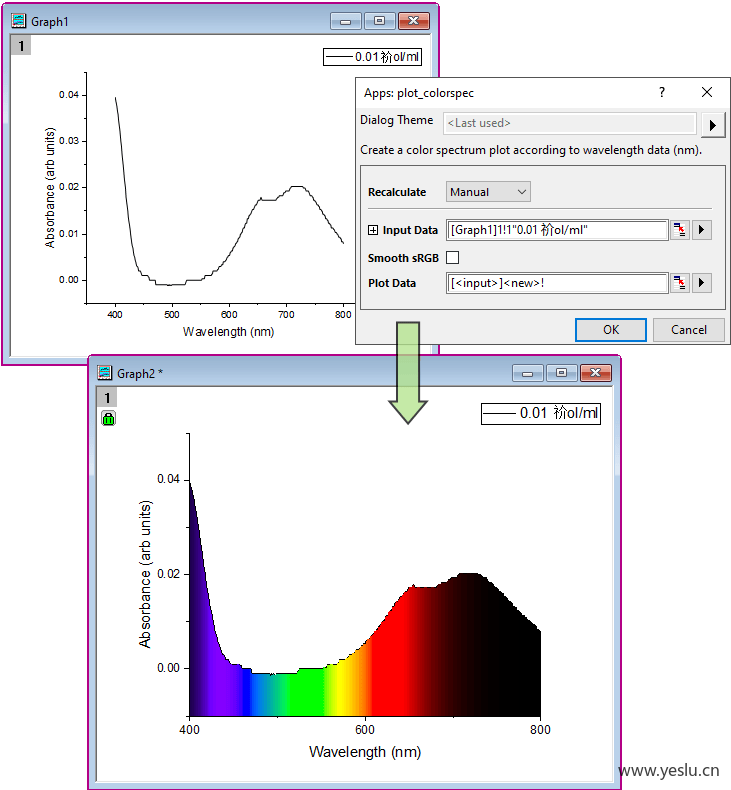
- 关键词:频谱、波长、价值观、RGB、某某
- Keywords: spectrum, wavelength, values, rgb, xyz
506 - Concave Hull
创建 2D 凹壳
Create 2D concave hull
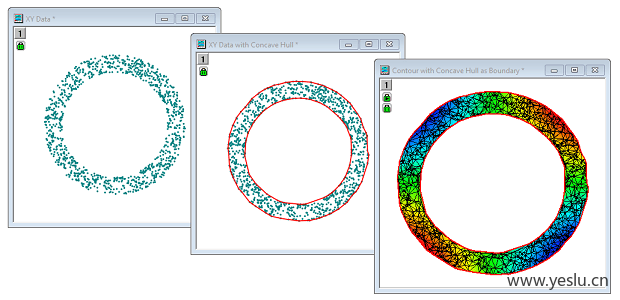
- 关键词:xy、结果、输入、图表、准备好了
- Keywords: xy, result, input, graph, set
574 - Correlation Plot
在图中显示包含 P 值的相关系数矩阵。
Display the correlation coefficient matrix including its P-value in a graph.
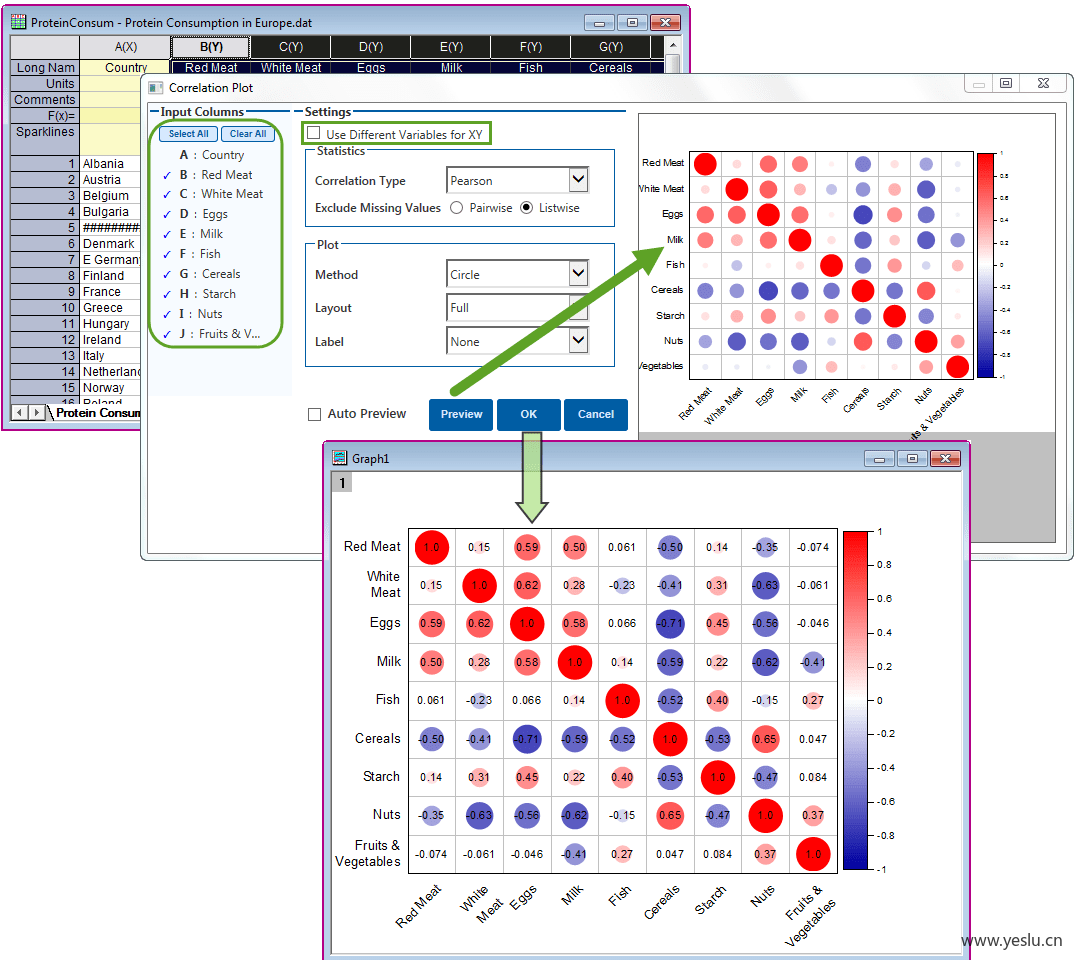
- 关键词:图表、三角形、柱子、价值、矩阵
- Keywords: graph, triangular, columns, value, matrix
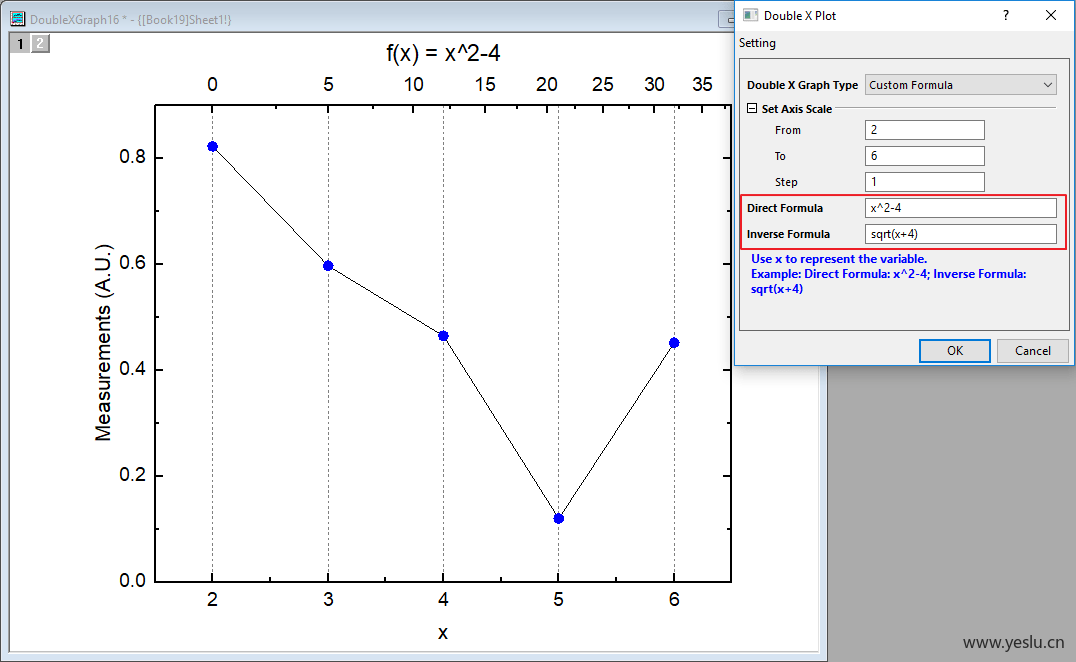
558 - Double X Plot
通过从预定义模板列表中进行选择,快速创建双 X 轴图形。
Quickly create Double X Axis graphs by selecting from a list of predefined templates.
- 关键词:对、轴、窗户、应用程序、类型检测
- Keywords: vs, axis, window, apps, type
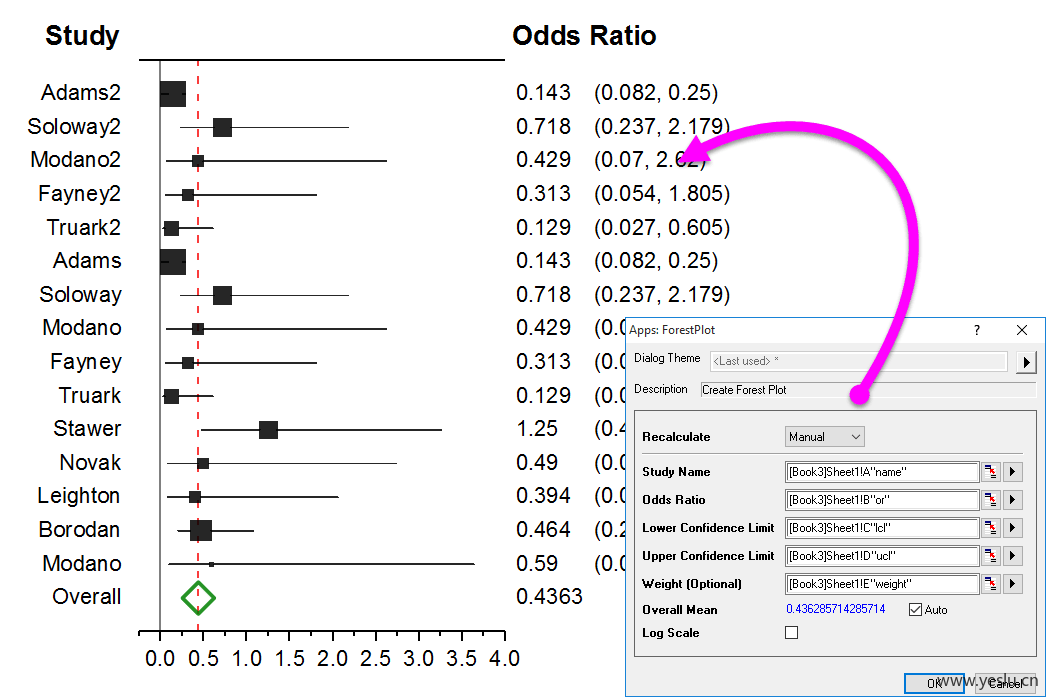
362 - Forest Plot
创建森林地块
Create Forest Plot
- 关键词:体重、可以选择、出现、比率、打开
- Keywords: weight, optional, appear, ratio, open
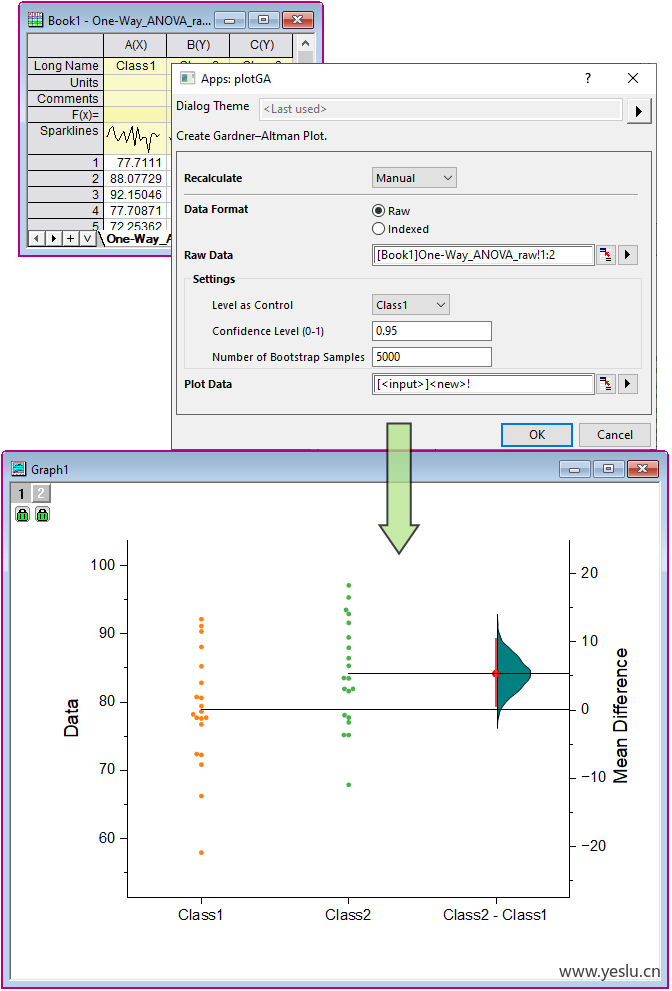
919 - Gardner-Altman Plot
使用原始数据或索引数据创建 Gardner-Altman 图,以比较平均差异。
Create Gardner–Altman plot with raw or indexed data to compare mean difference.
- 关键词:帽子、二、_0、水平、阿尔法
- Keywords: hat, two, _0, levels, alpha
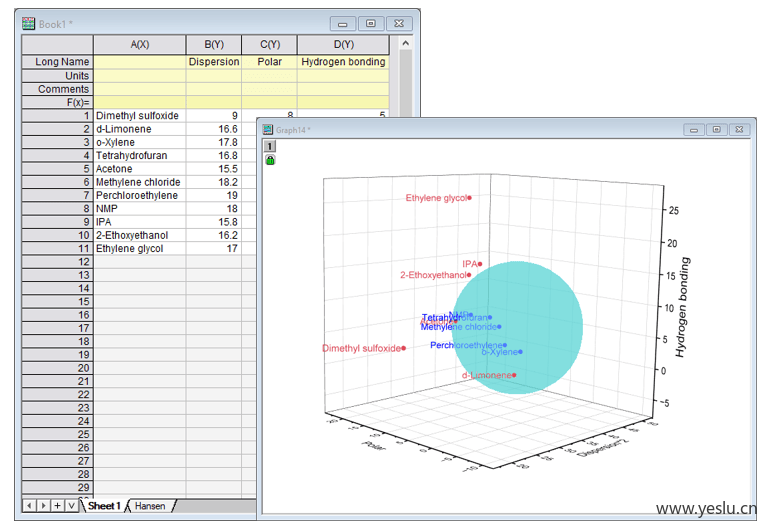
890 - Hansen Solubility Parameter Plot
用 Hansen 溶解度参数绘制溶质球和溶剂坐标。
Plot solute sphere and solvent coordinates using Hansen solubility parameters.
- 关键词:三角洲、溶剂、Hansen、样本、溶质
- Keywords: delta_, solvent, hansen, sample, solute
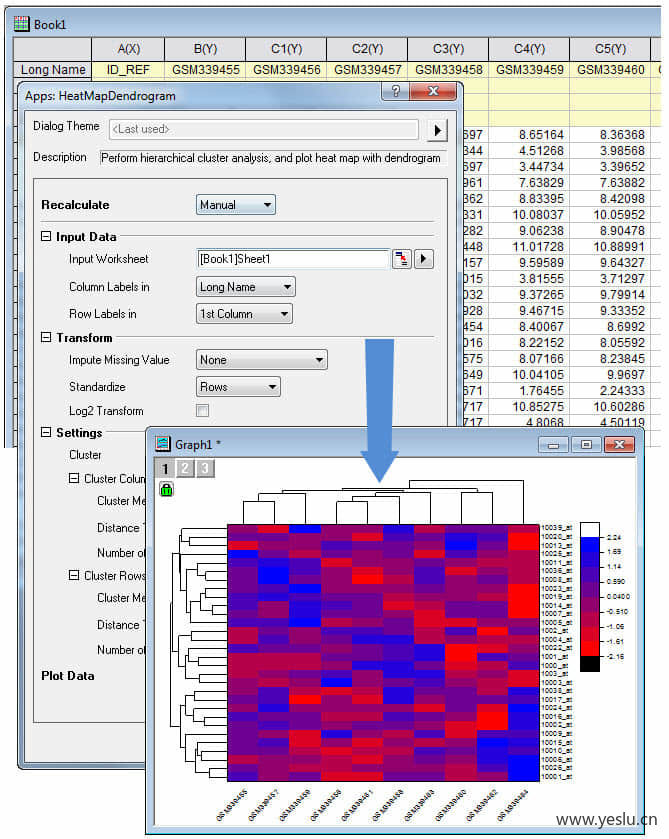
223 - Heat Map with Dendrogram
沿着列和行执行分层数据聚类,并用树状图(PRO Only)绘制热图
Perform hierarchical cluster analysis along columns and rows, and plot heat map with dendrogram (PRO Only)
- 关键词:对话、分析、等级森严、工具、打开
- Keywords: dialog, analysis, hierarchical, tool, open
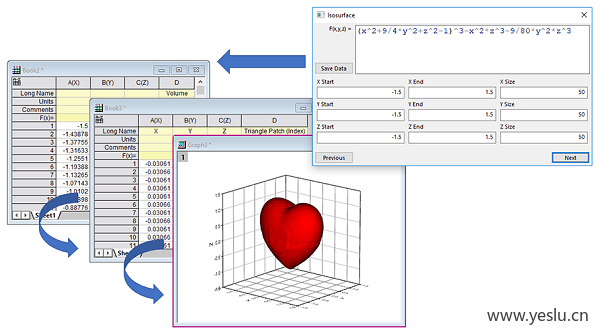
495 - Isosurface Plot
根据常规体积数据创建等值面。
Create isosurface from regular volume data.
- 关键词:预览、床单、图表、补丁、等表面
- Keywords: preview, sheet, graph, patches, isosurface
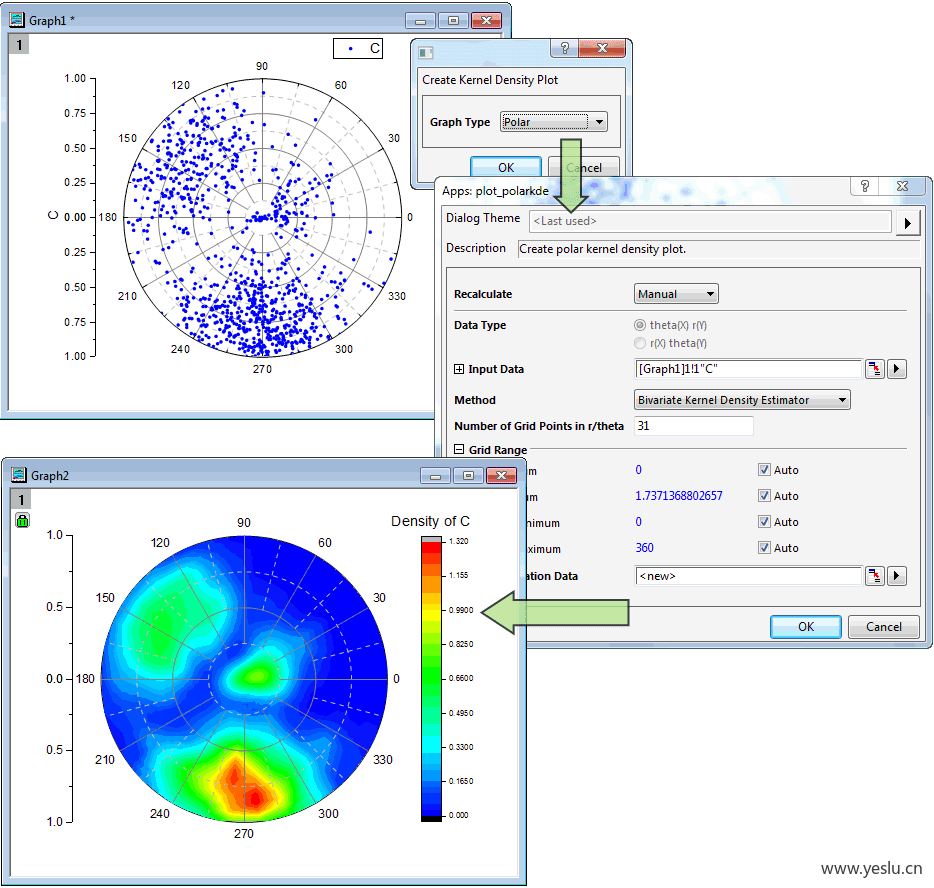
408 - Kernel Density Plot
为笛卡尔、极坐标或三元数据创建内核密度图。
Create kernel density plot for Cartesian, Polar, or Ternary data.
- 关键词:密度、三元、极地、阴谋、内核
- Keywords: density, ternary, polar, plot, kernel
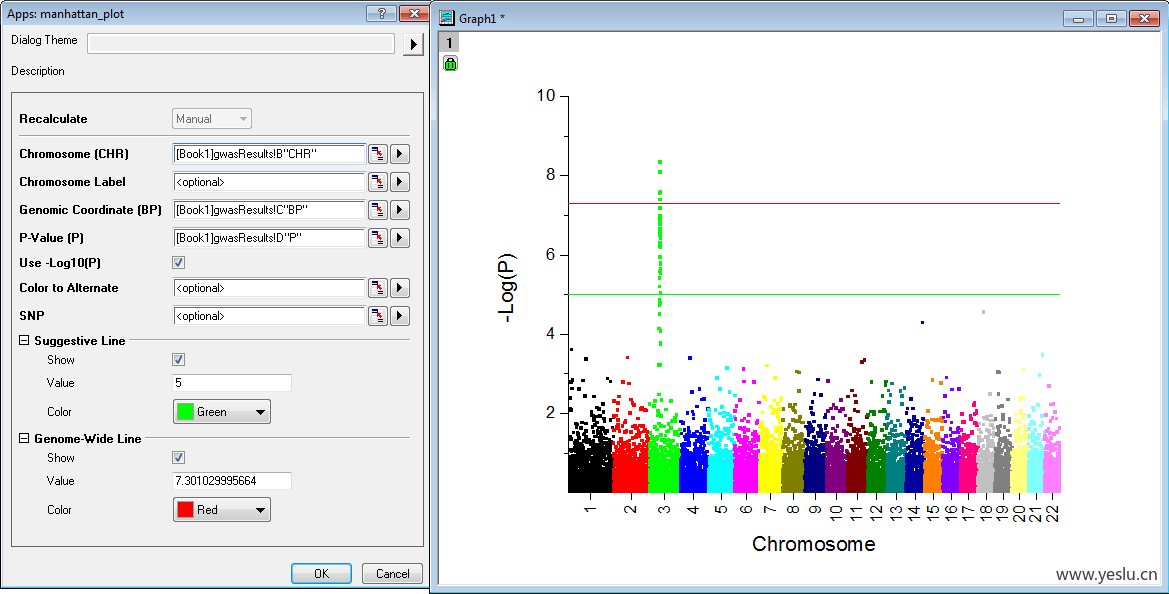
324 - Manhattan Plot for GWAS
为 GWAS (全基因组关联研究)创建曼哈顿图。
Create Manhattan Plot for GWAS (Genome-Wide Association Studies).
- 关键词:台词、颜色、别说了、价值、具体说明
- Keywords: line, color, snp, value, specify
240 - Maps Online
从 WMS 服务器获取地图图像,并将其作为背景图像放在图形中。
Fetch map image from a WMS server and place as background image in a graph.
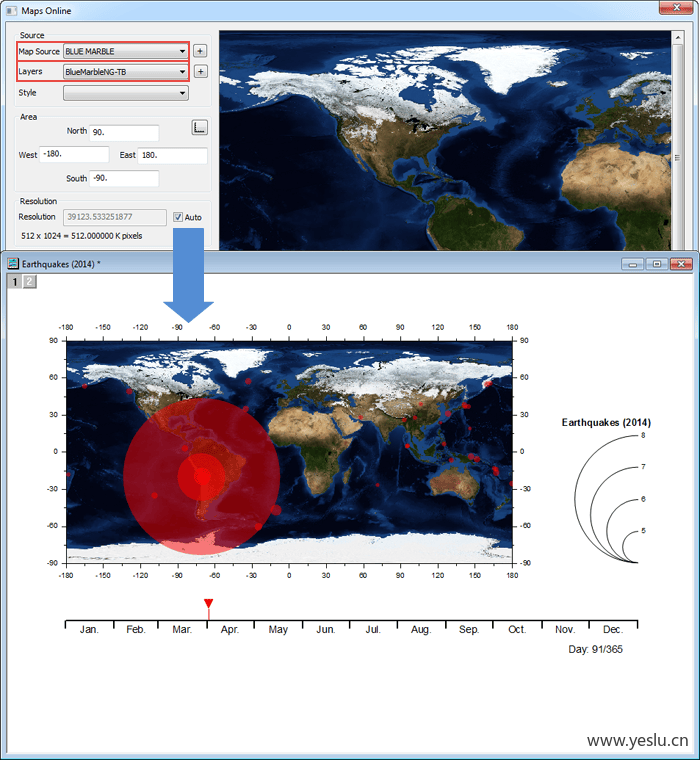
- 关键词:地图、图表、来源、激活、窗户
- Keywords: map, graph, source, active, window
327 - Means Plot
为分组数据创建2D 均值-错误图。
Create 2D means-with-error plot for grouped data.
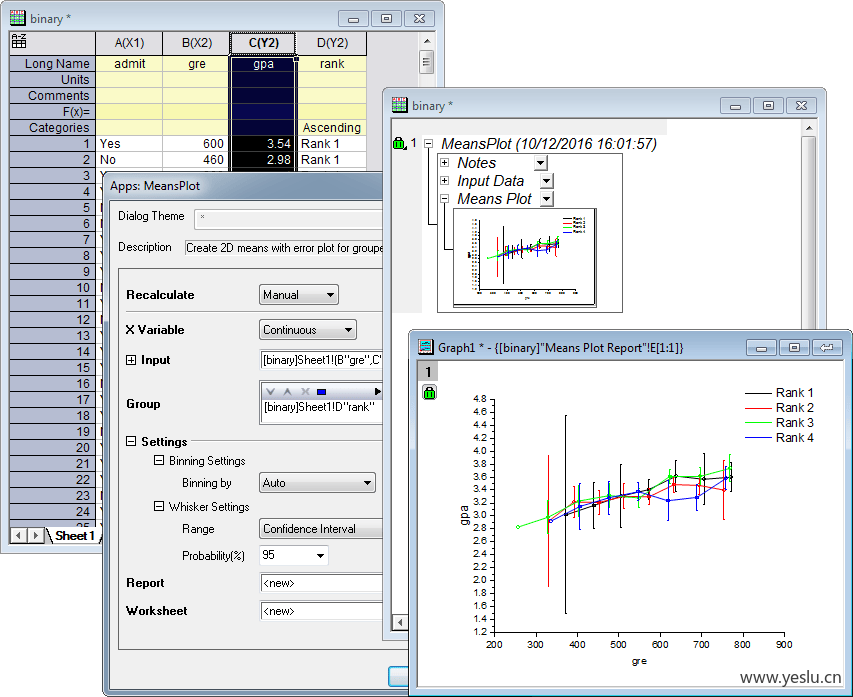
- 关键词:小组、水平、根据、工具、一
- Keywords: group, levels, according, tool, one
390 - Paired Comparison Plot
为成对比较创建具有显著差异的情节
Create plots with significant differences for pairwise comparison
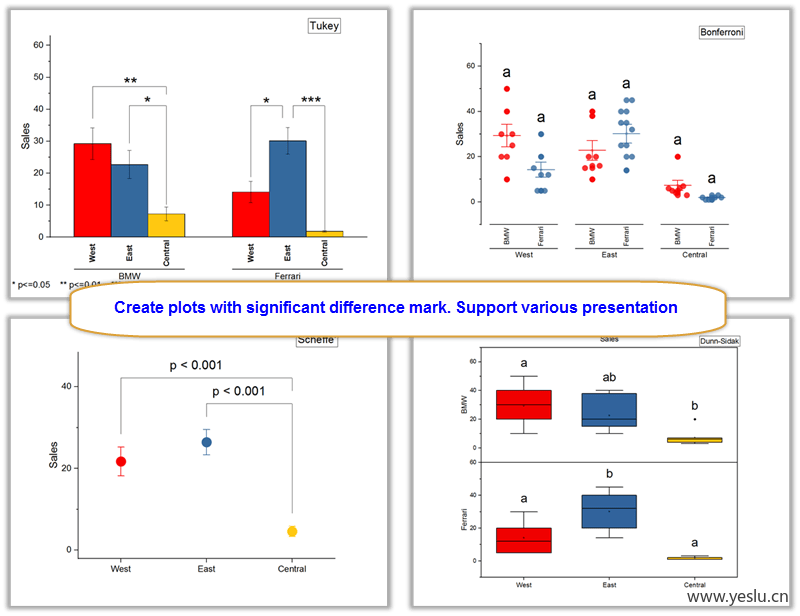
- 关键词:小组、Anova、选吧、一、阴谋
- Keywords: group, anova, choose, one, plot
449 - Phylogenetic Tree
绘制系统发生树,交换子树,从一个节点重新根树。
Plot phylogenetic tree, swap subtrees and reroot tree from a node.
- 关键词:上、样本、对、画廊、拯救
- Keywords: onto, sample, right, gallery, save
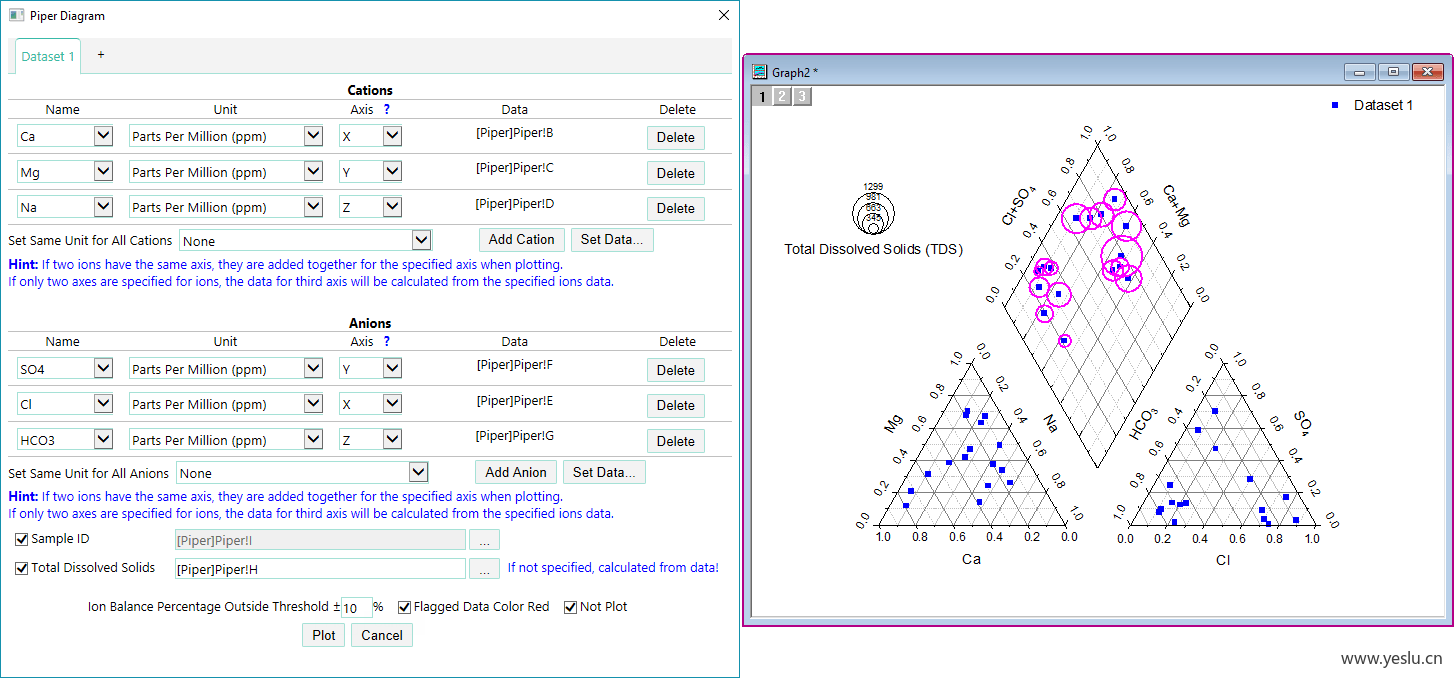
543 - Piper Diagram
使用指定的离子数据集制作风笛图。
Make piper diagram using specified ions dataset.
- 关键词:纽扣、专栏、离子、准备好了、工作表
- Keywords: button, column, ion, set, worksheets
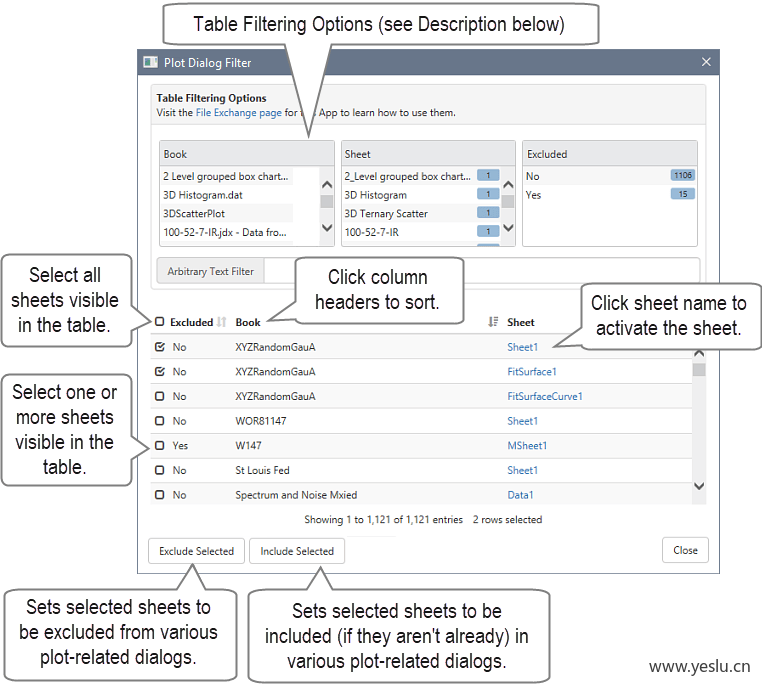
450 - Plot Dialog Filter
筛选出现在各种情节相关对话框中的选定工作表,排除它们(通过 wks.epd 属性)。
Filter selected sheets from appearing in various plot-related dialogs by excluding them (via wks.epd property).
- 关键词:床单、梅、号码、对话、床单
- Keywords: sheets, may, number, dialogs, sheet
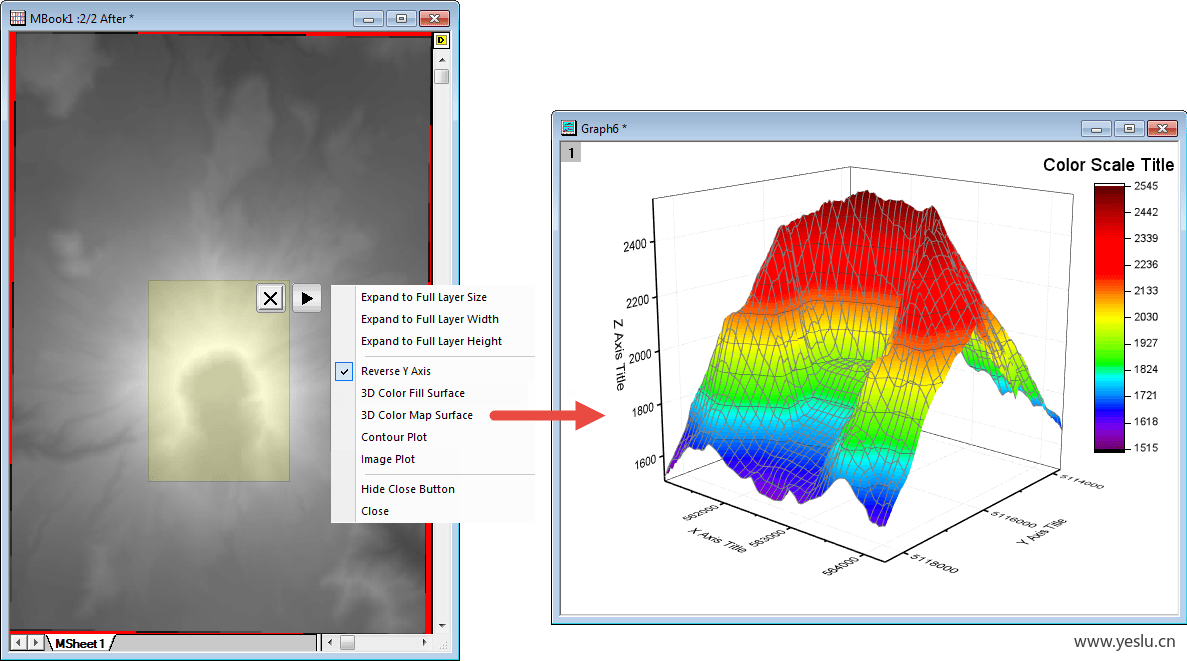
228 - Plot Sub Matrix
交互式地检查矩阵的选定子范围作为一个三维表面,轮廓或图像绘图。
Interactively examine selected sub range of a matrix as a 3D surface, contour or image plot.
- 关键词:国王、矩阵、阴谋、潜艇、形象
- Keywords: roi, matrix, plot, sub, image
404 - Poincare Plot
创建带有置信椭圆的 Poincaré 图
Create Poincaré plot with a confidence ellipse
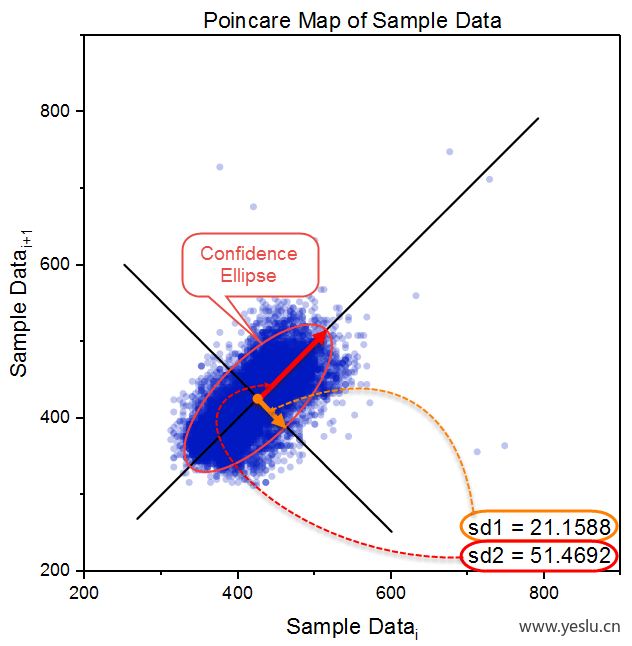
- 应用目标:该应用程序可用于根据指定的阿尔法值创建带有置信椭圆的 Poincare 图。
- Propose: This app can be used to create a Poincare plot with a confidence ellipse from a specified alpha value.
- 关键词:庞加莱图、置信椭圆、α值
- Keywords: Poincare Plot, Confidence Ellipse, Alpha Value
314 - Polar Contour Profile
极坐标图的计算剖面。
Compute profile for polar contour plot.
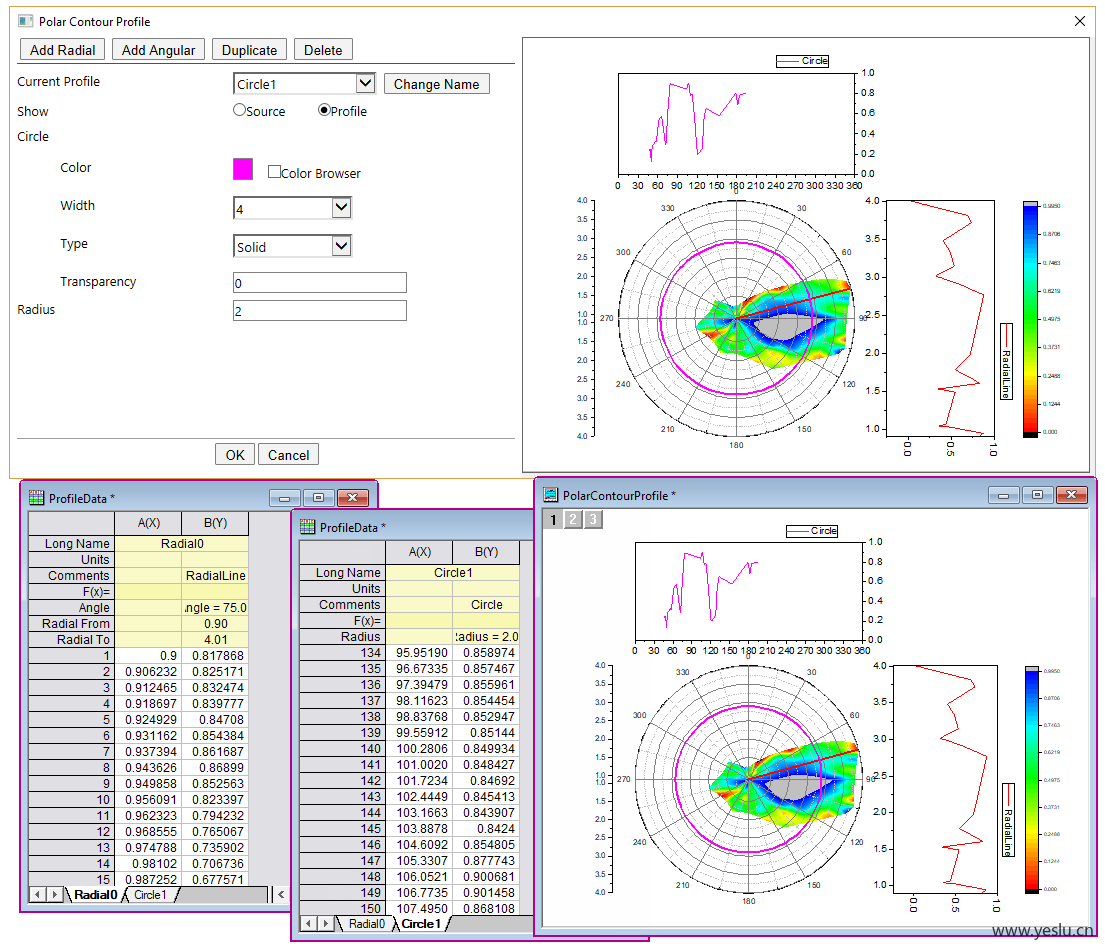
- 关键词:侧写、台词、方向、放射状、纽扣
- Keywords: profile, line, direction, radial, button
612 - Polar Heatmap with Dendrogram
沿着柱子和行执行分层数据聚类,并用圆形树状图绘制极地热图。
Perform hierarchical cluster analysis along columns and rows, and plot polar heatmap with circular dendrogram.
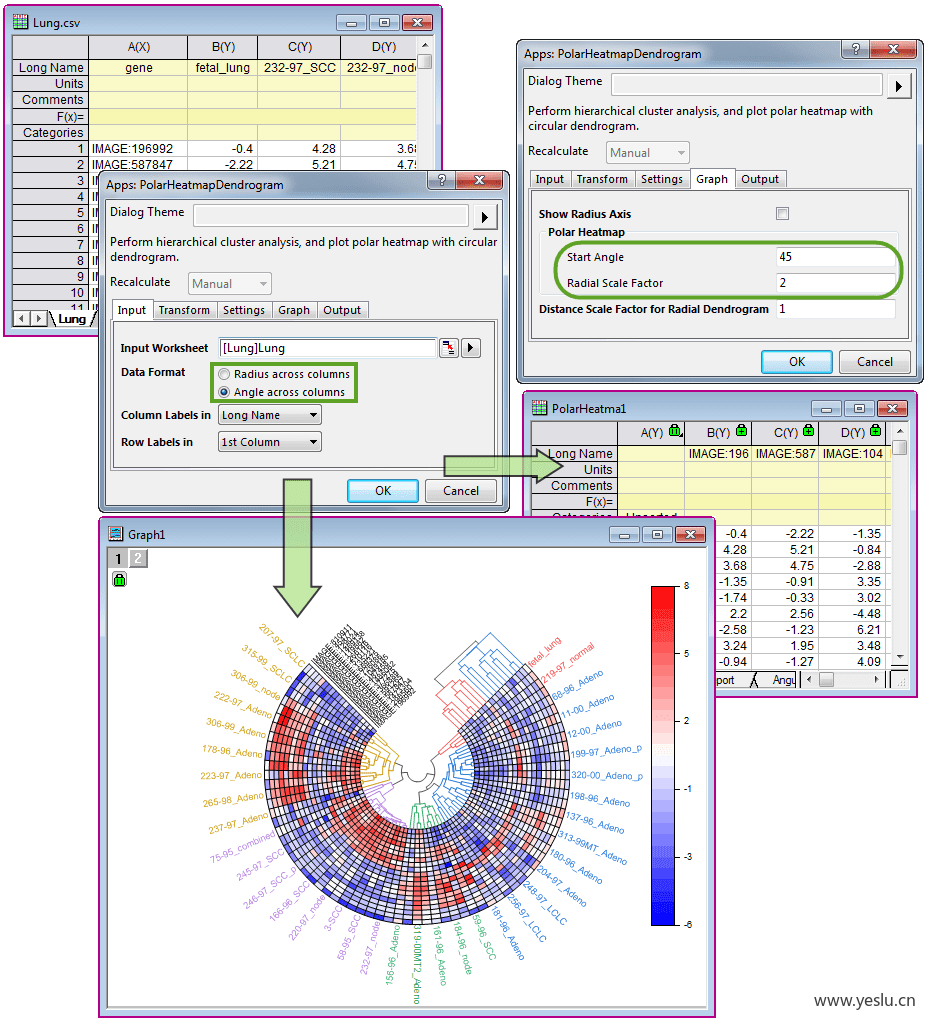
- 关键词:树状图、热图、放射状、圆形的、用过
- Keywords: dendrogram, heatmap, radial, circular, used
284 - Polyline Profiles
从图像或等高线图生成直线、折线或徒手线轮廓。
Generate straight, polyline or freehand line profiles from image or contour plots.
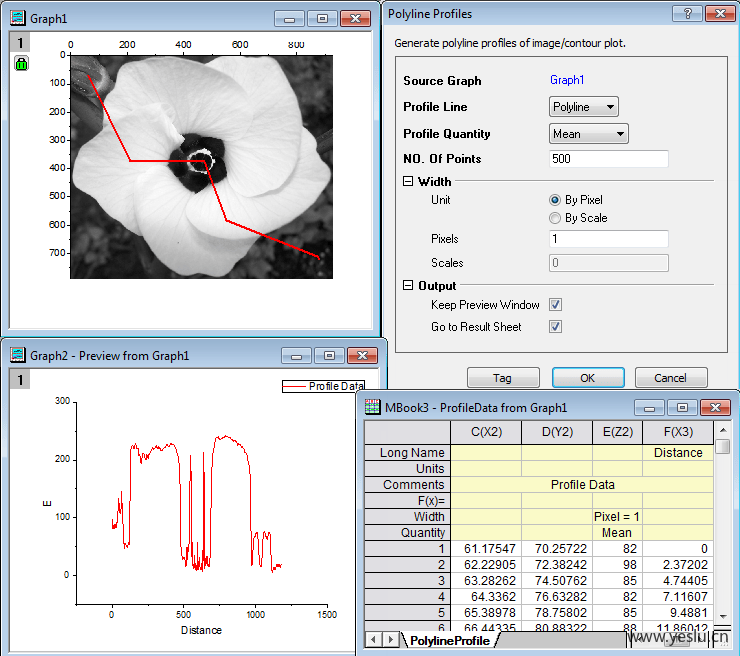
- 关键词:台词、对象、阴谋、侧写、形象
- Keywords: line, object, plot, profile, image
605 - Rectangle and Ellipse Profile
获取矩形和椭圆的分析数据。
Get profiling data for rectangle and ellipse.
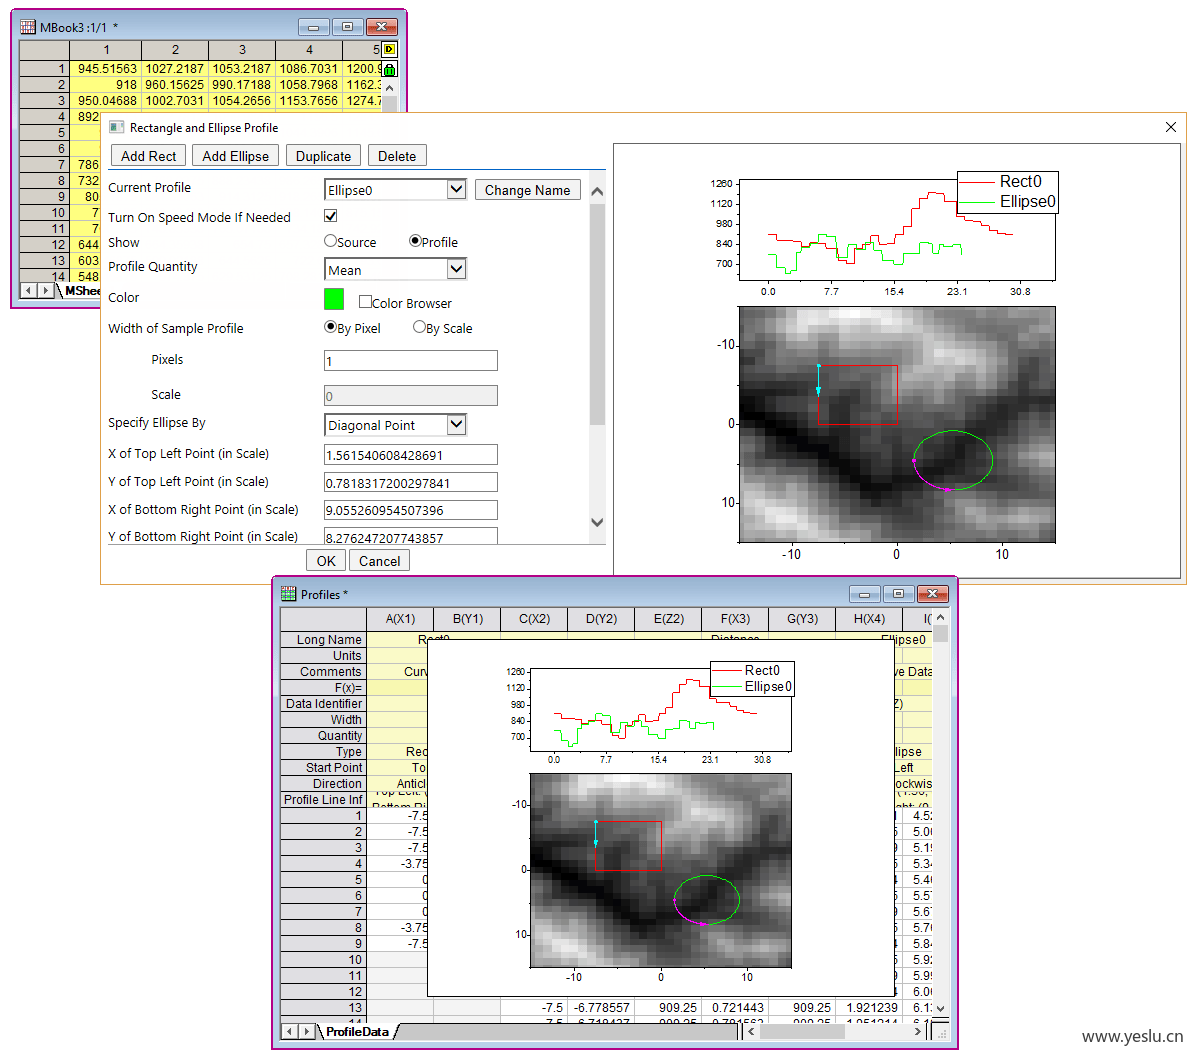
- 关键词:点、侧写、长方形、椭圆、规模
- Keywords: point, profile, rectangle, ellipse, scale
316 - Soil and Rocks Classification Diagrams
为土壤和岩石提供三元图模板。
Provide ternary plot templates for soils and rocks.
- 关键词:选择、模板、新的、分类、Le
- Keywords: select, template, new, classification, le
588 - Taylor Diagram
创建泰勒图以便于对不同模型进行比较评估。
Create taylor diagram for facilitating the comparative assessment of different models.
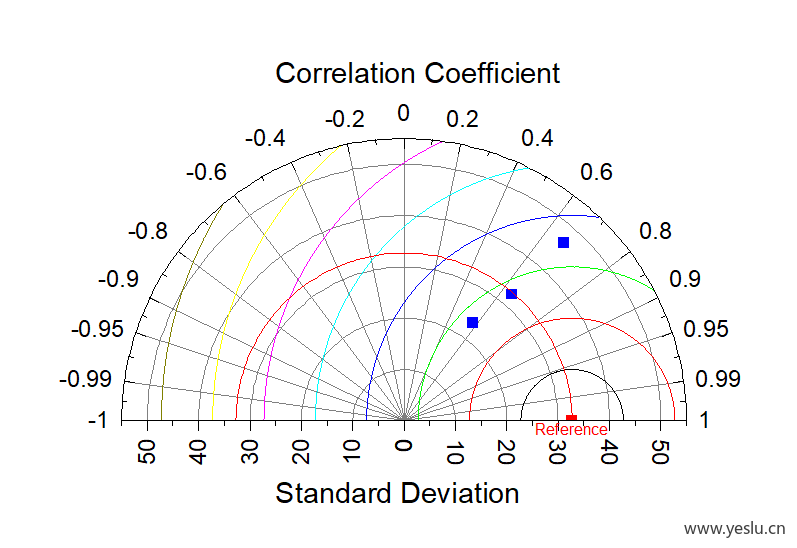
- 关键词:标签、参考文献、具体说明、专栏、系数
- Keywords: labels, reference, specify, column, coefficient
672 - Ternary Contour Profile
对三元等高线图进行剖面分析。
Perform profiling on ternary contour plot.
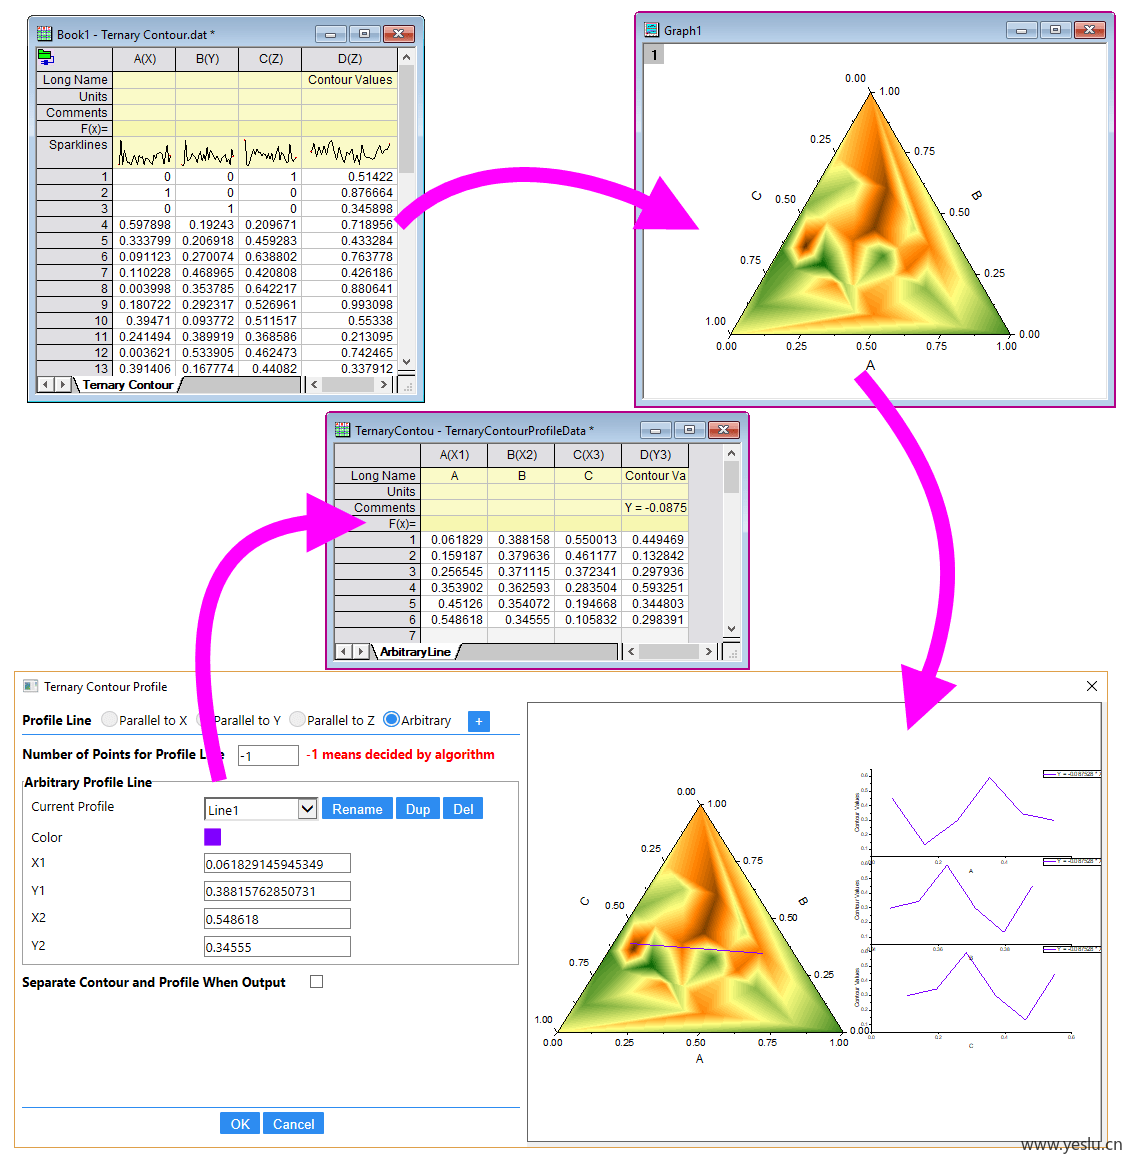
- 关键词:侧写、台词、侧写、目前、纽扣
- Keywords: profile, line, profiling, current, button
678 - Torsional Angle Wheel Plot
创建扭转角度的车轮图。
Create torsional angle wheel plot.
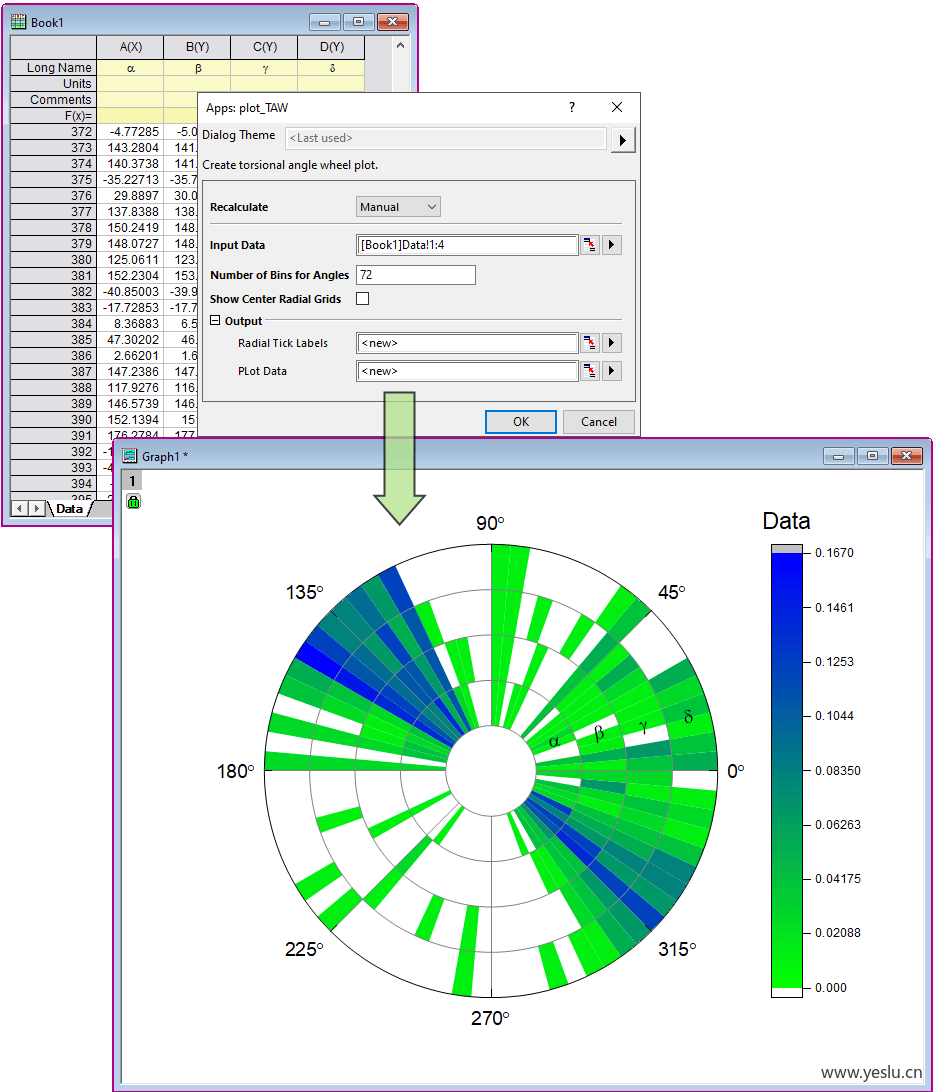
- 关键词:角度、放射状、应用程序、间隔、小组
- Keywords: angles, radial, theapps, interval, group
303 - Treemap Plot
创建具有自定义顺序和颜色的树图图形。
Create treemap plot with custom order and coloring.
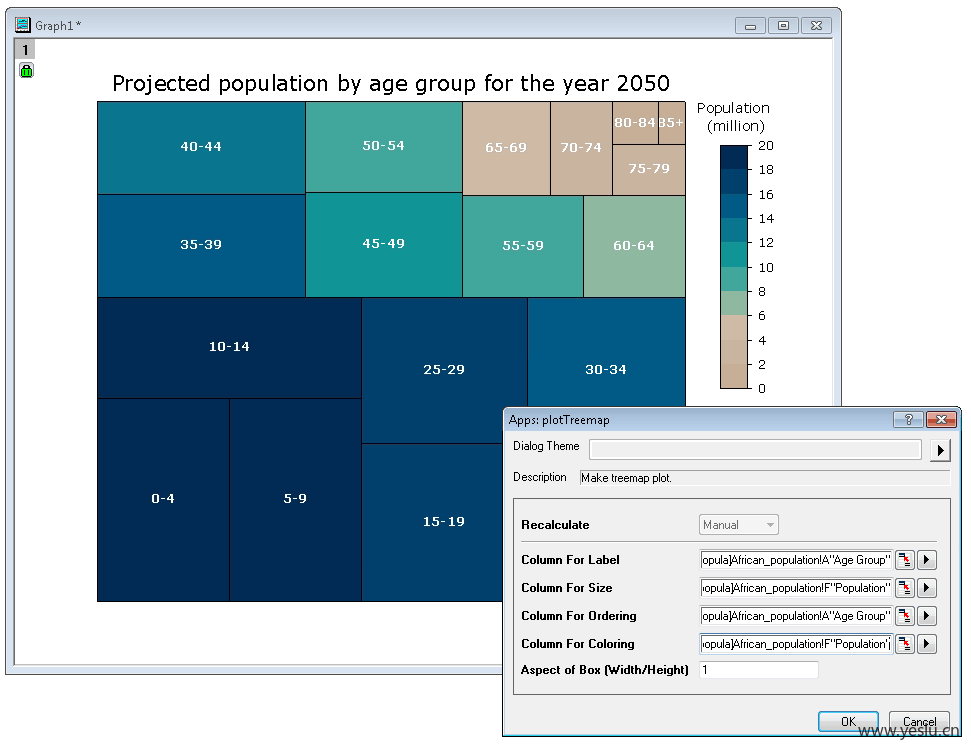
- 关键词:树木地图、阴谋、柱子、尺寸、具体说明
- Keywords: treemap, plot, columns, size, specify
425 - Venn Diagram
创建维恩图
Create Venn Diagram
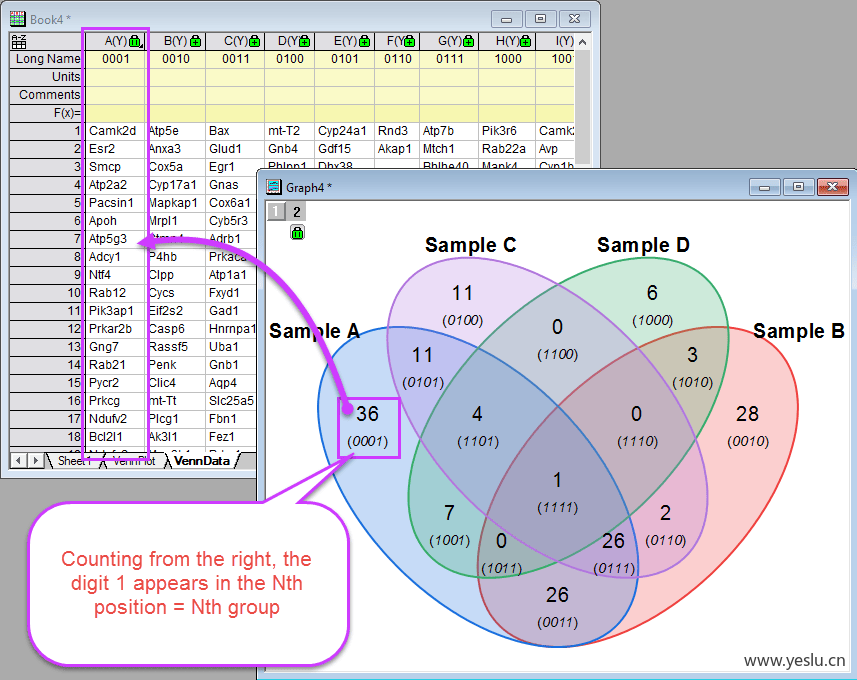
- 关键词:出现、号码、设置、真的、人际关系
- Keywords: appear, number, sets, actual, relationships
296 - Volcano Plot
创建褶皱变化和 p 值数据的火山图。
Create volcano plot for fold change and p-value data.
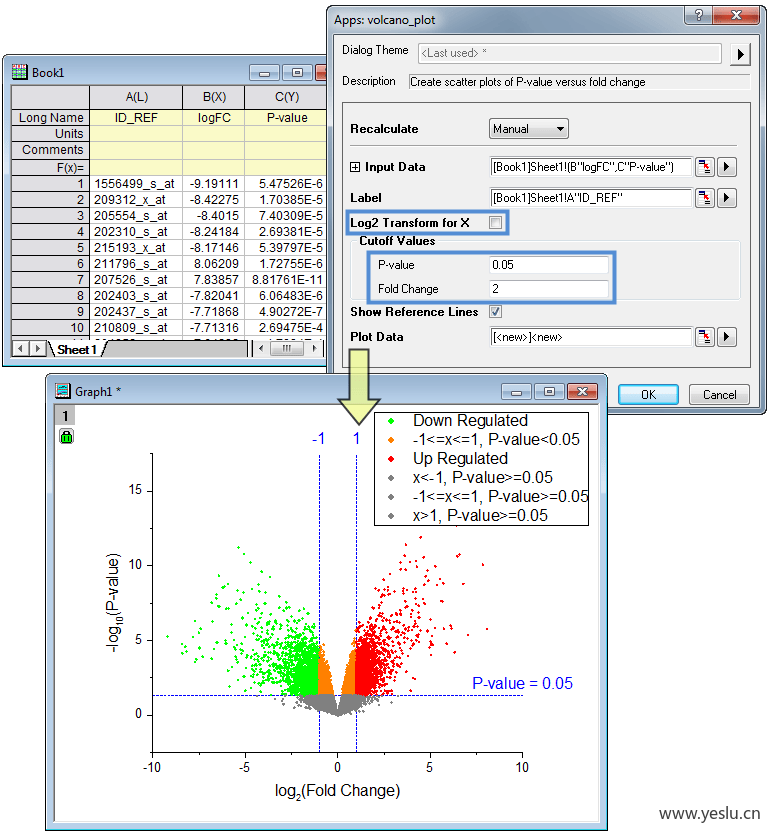
- 关键词:改变、弃牌、阴谋、切断、价值
- Keywords: change, fold, plot, cutoff, value
416 - Voronoi Diagram
Voronoi 图。
Voronoi diagram.
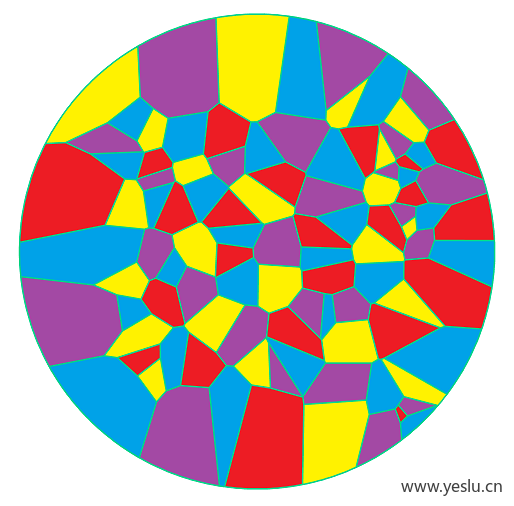
- 关键词:Xy、图解、地区、2D、详情
- Keywords: xy, diagram, region, 2d, details
471 - Word Cloud
根据提供的数据生成单词云图像
Generate the word cloud image from the provided data
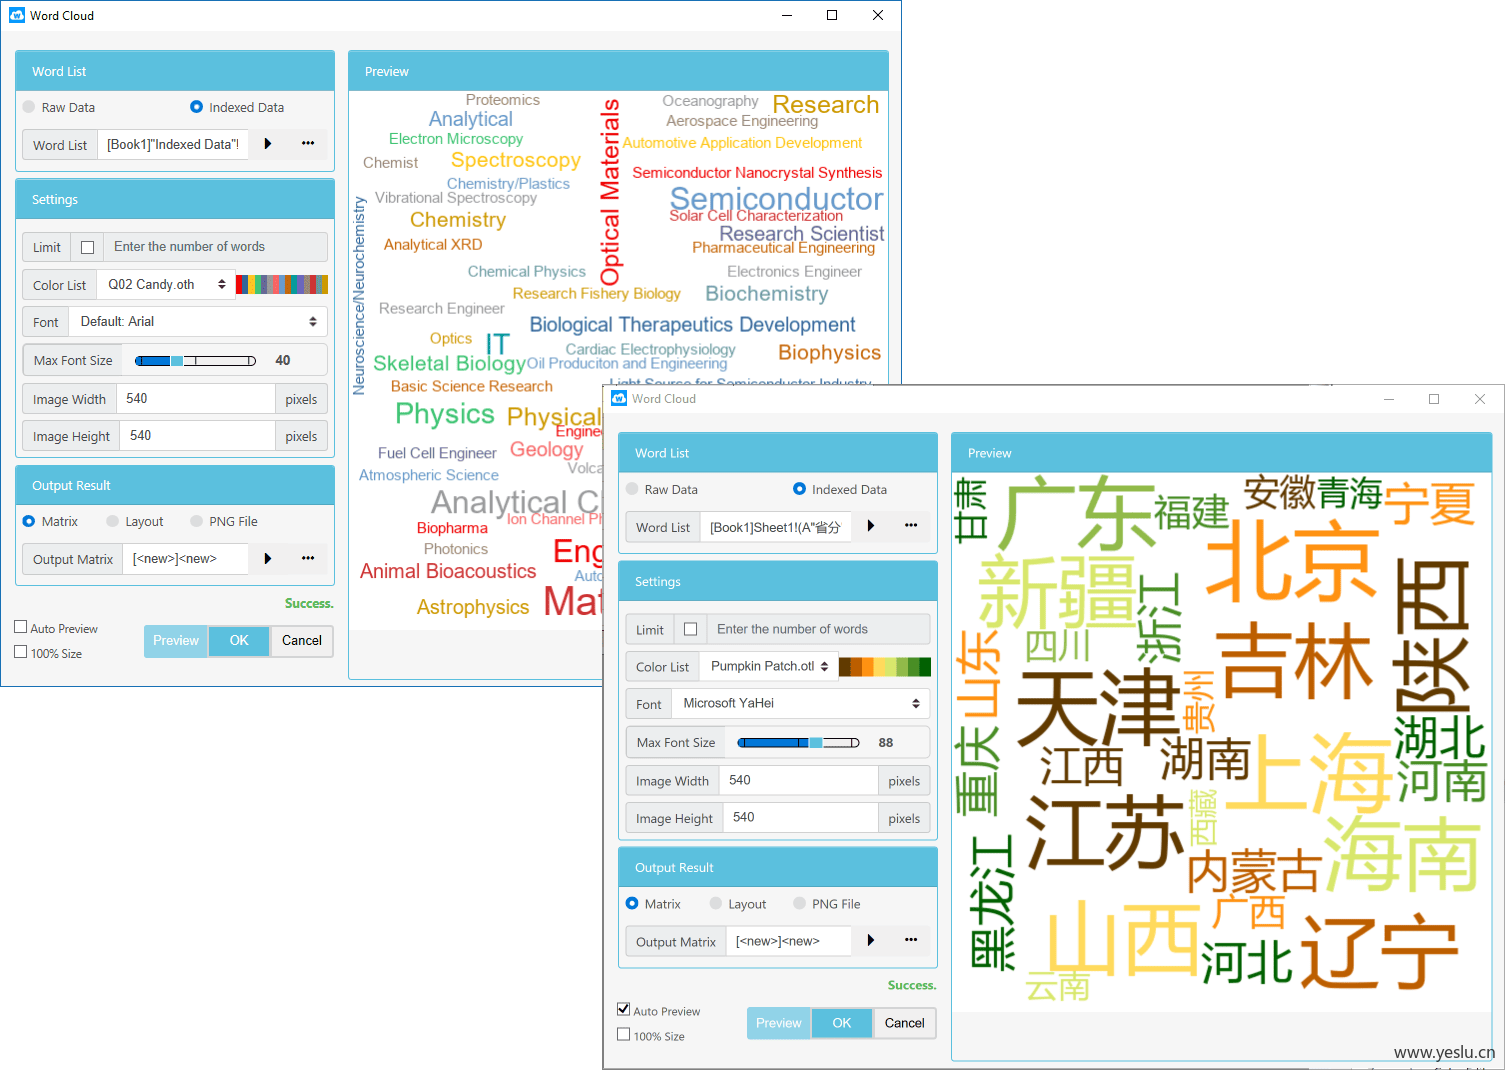
- 关键词:字、云、形象、预览、面板
- Keywords: word, cloud, image, preview, panel
554 - X-Ray Diffraction Analysis
这个应用程序可以帮助做简单的 X 射线衍射分析在 Origin 。
This app can help to do simple X-Ray diffraction analysis in Origin.
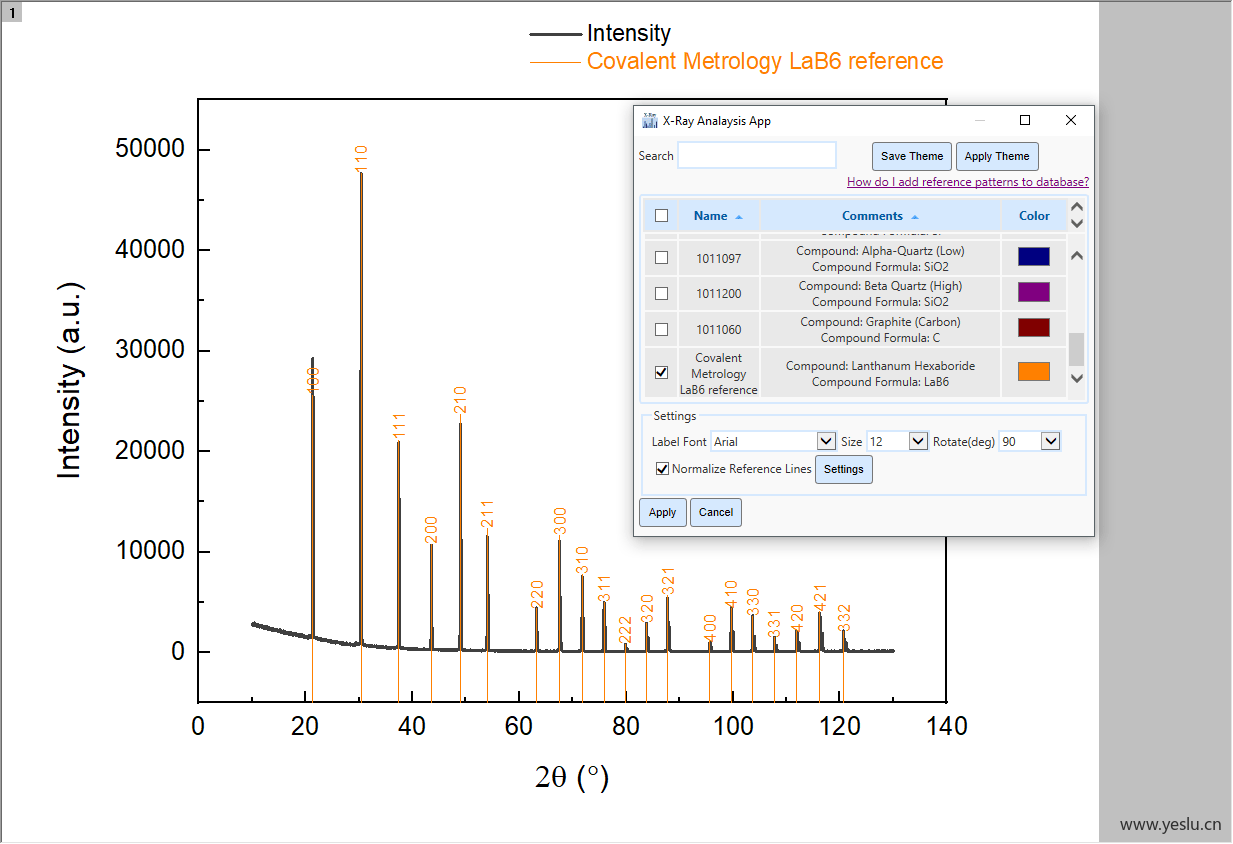
- 关键词:参考文献、模式、拯救、资料库、加
- Keywords: reference, patterns, save, database, add
998 - Youden Plot
帮助创建尤登情节
Help to create Youden Plot
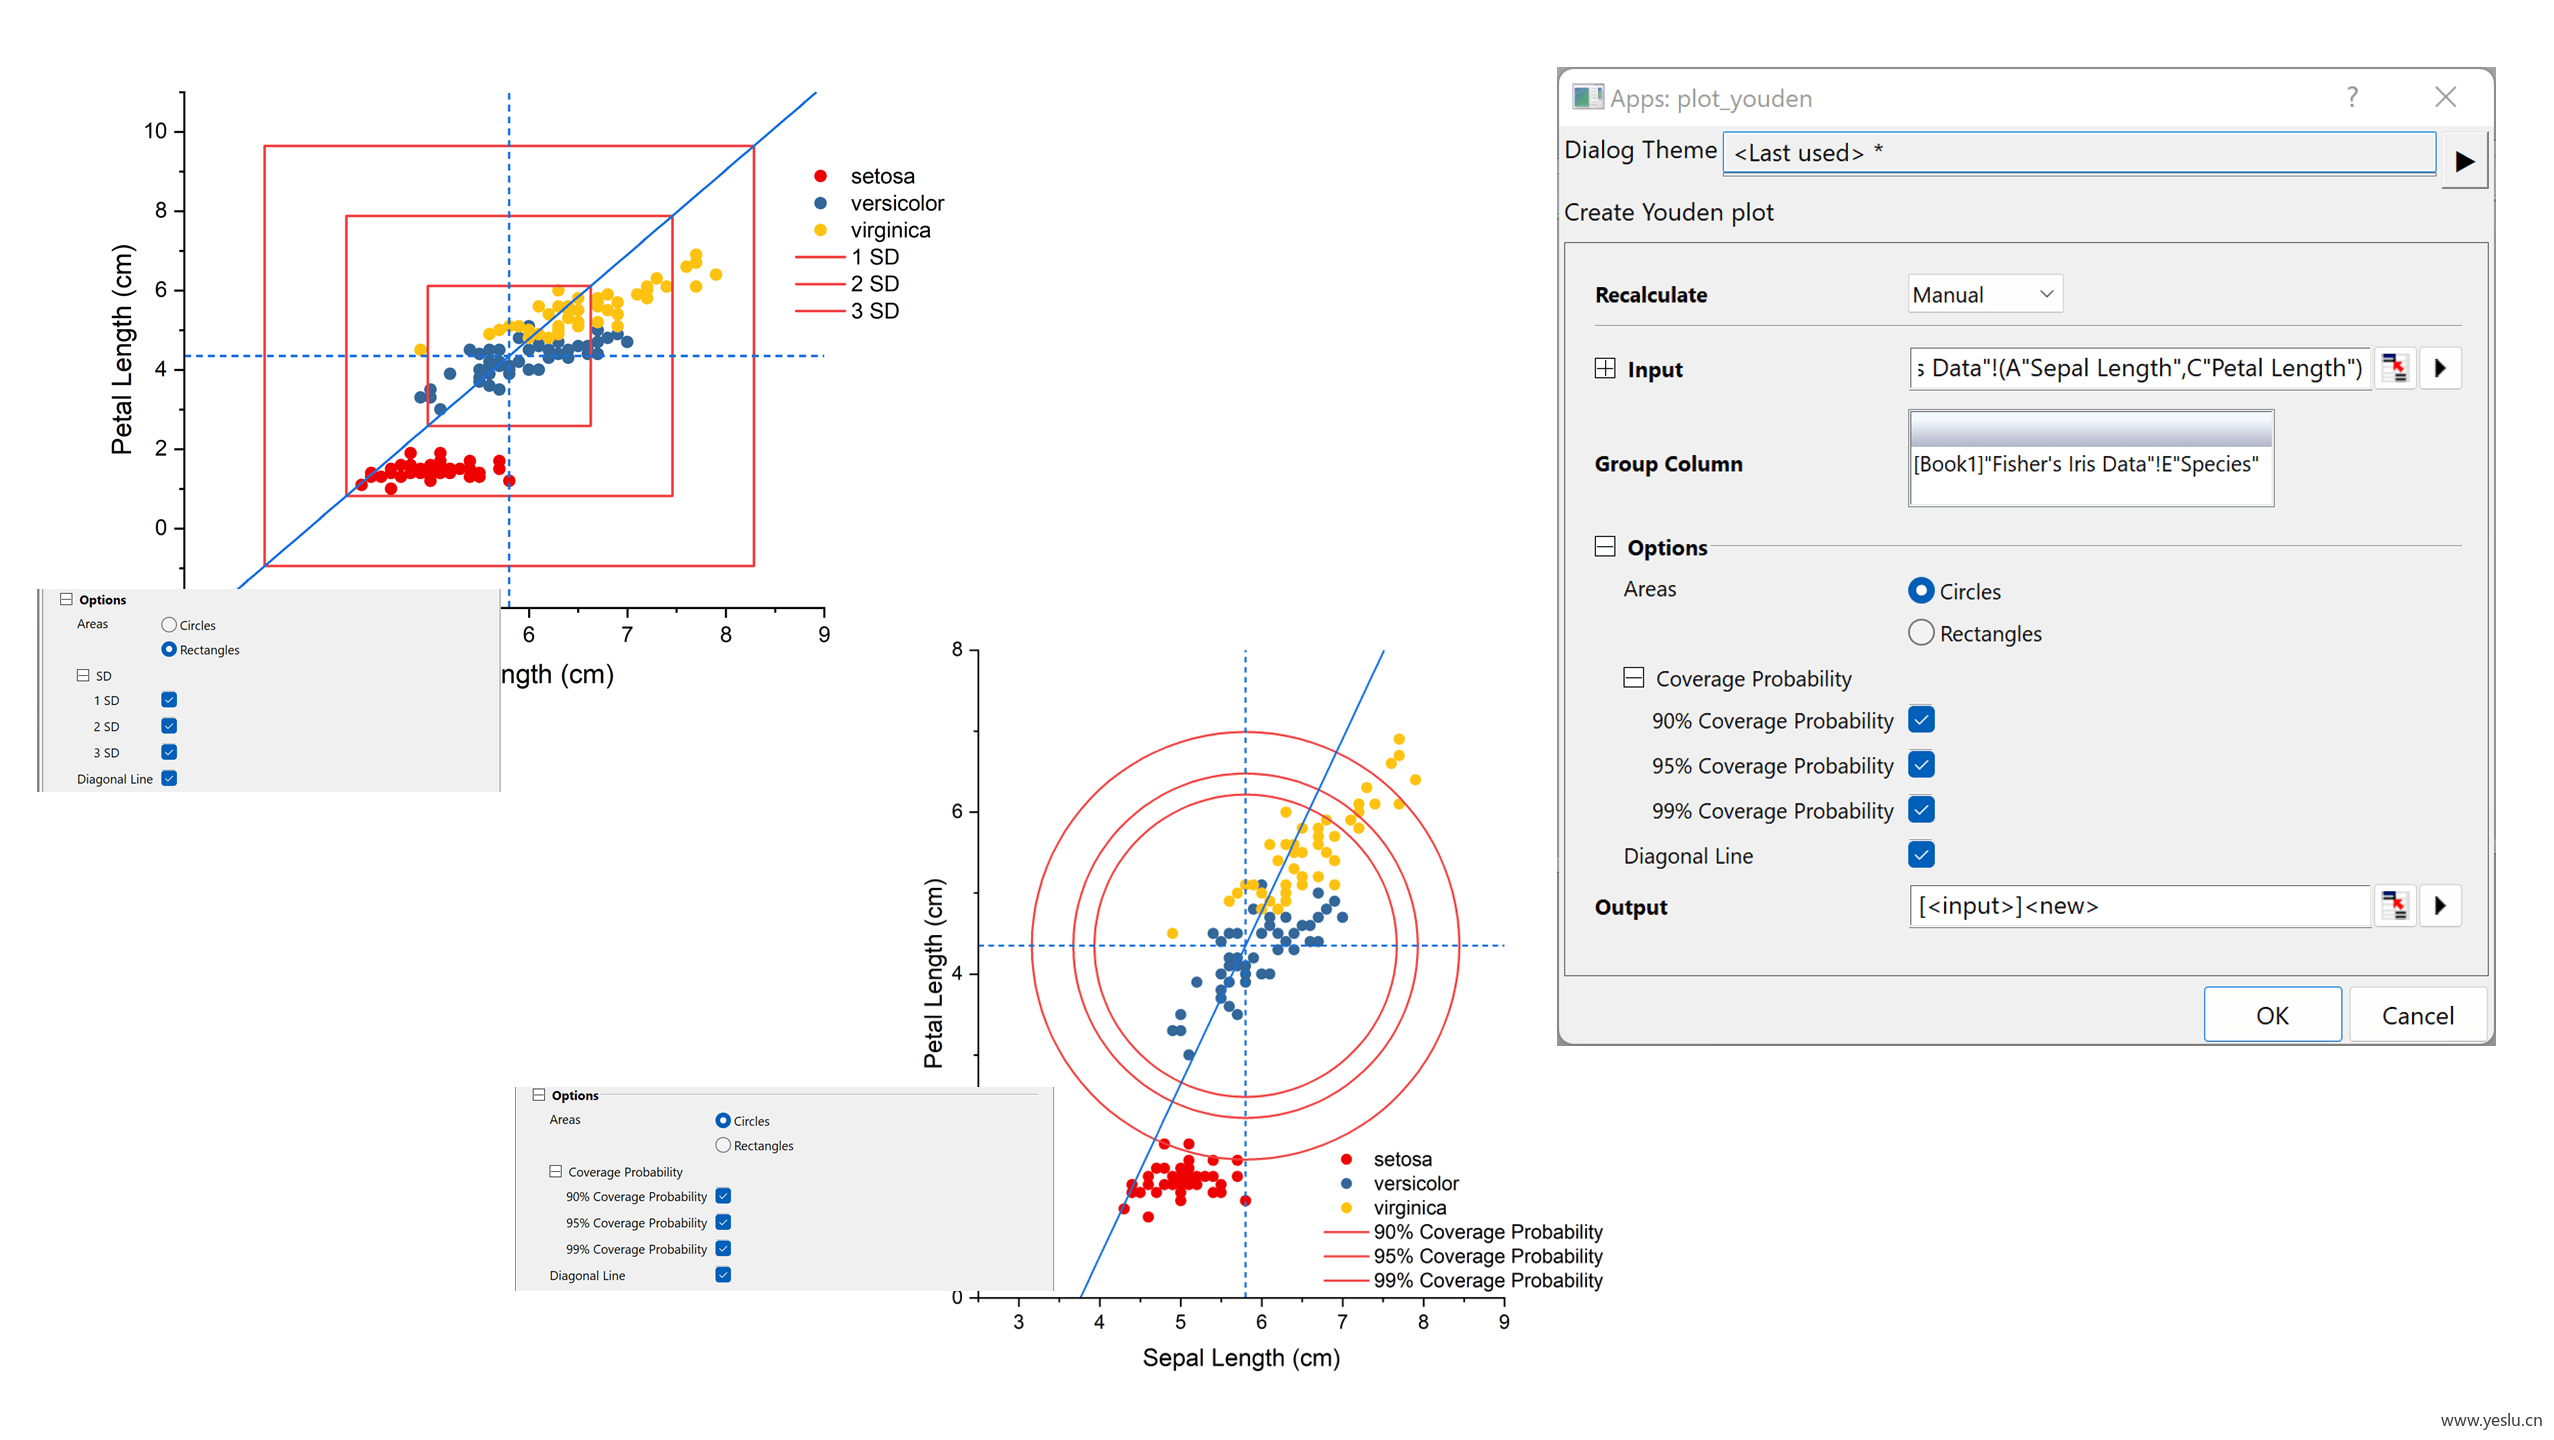
- 关键词:实验室、具体说明、阴谋、尤登、可变性
- Keywords: laboratory, specify, plot, youden, variability
3D 专业图表
229 - 3D Antenna Radiation Pattern
协助准备数据并绘制三维天线辐射图。
Help to prepare data and plot 3D antenna radiation pattern.
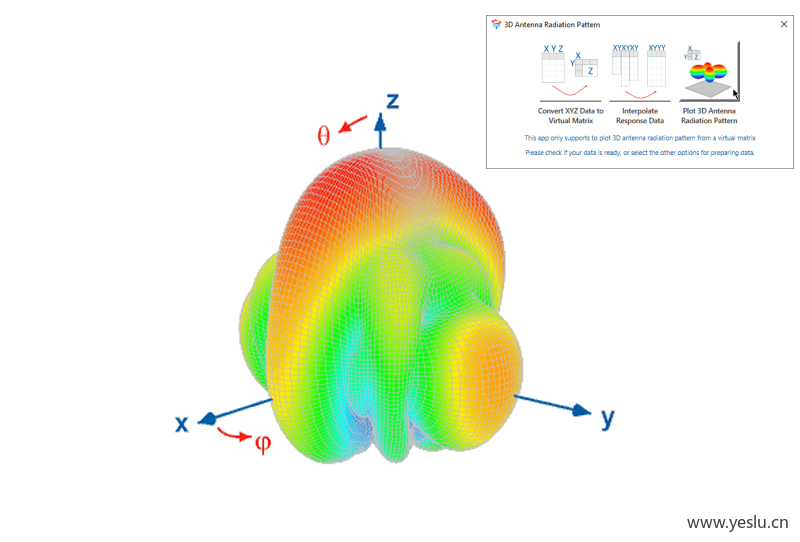
- 关键词:回应、矩阵、专栏、方位角、价值
- Keywords: response, matrix, column, azimuth, value
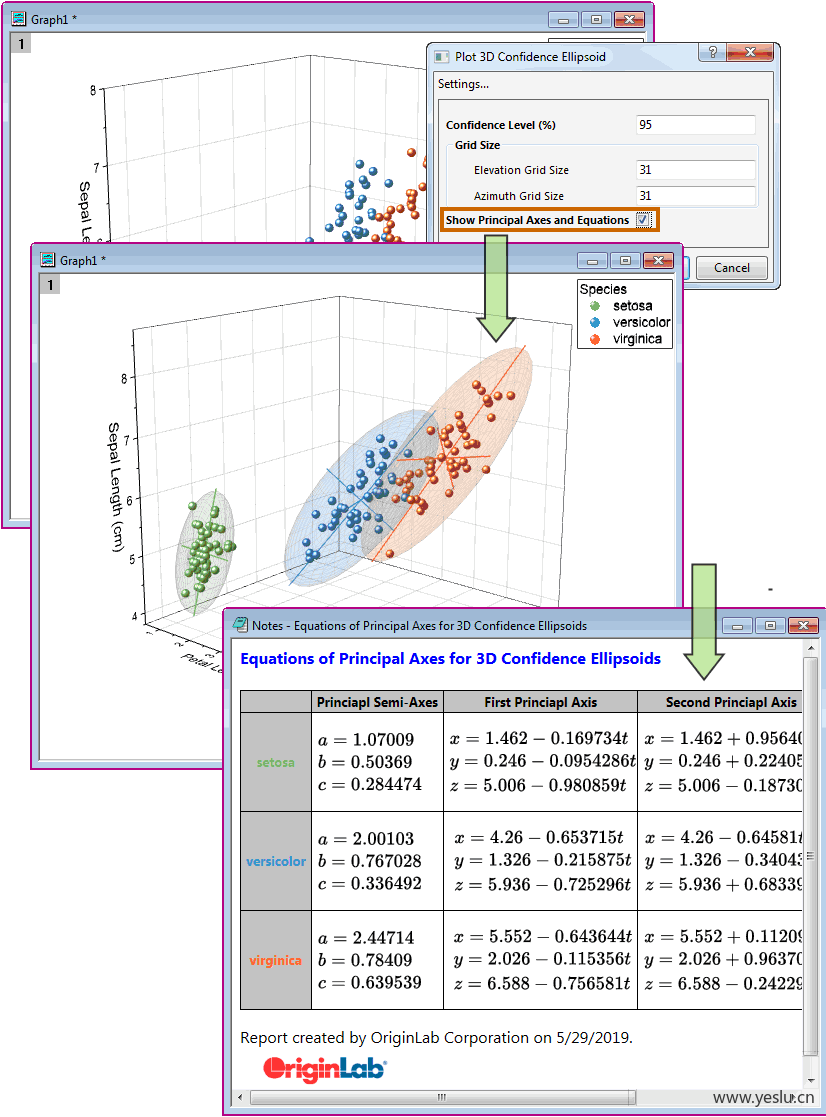
280 - 3D Confidence Ellipsoid
绘制三维散点数据的三维置信椭球(仅 PRO)。
Plot 3D confidence ellipsoid for 3D scatter data (PRO Only).
- 关键词:阴谋、椭球体、散开、自信、图表
- Keywords: plot, ellipsoid, scatter, confidence, graph
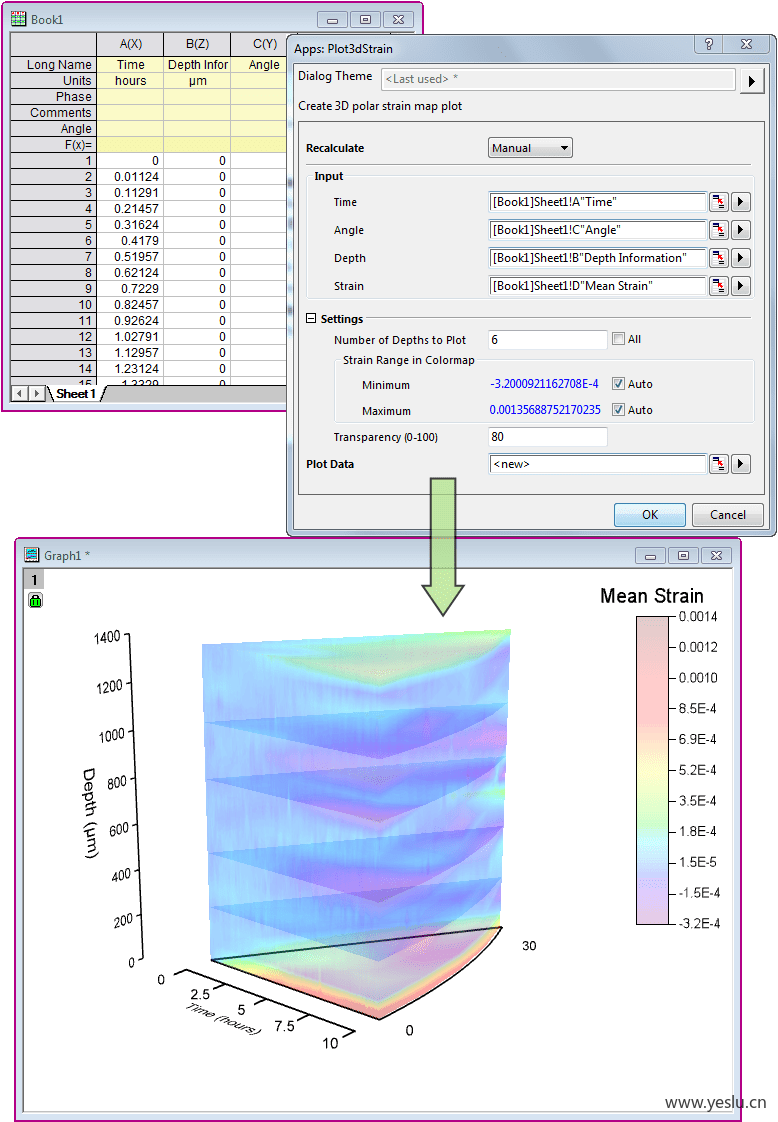
590 - 3D Polar Strain Map
创建三维极地应变图。
Create 3D polar strain map plot.
- 关键词:紧张、极地、深度、应用程序、角度
- Keywords: strain, polar, depth, theapps, angle
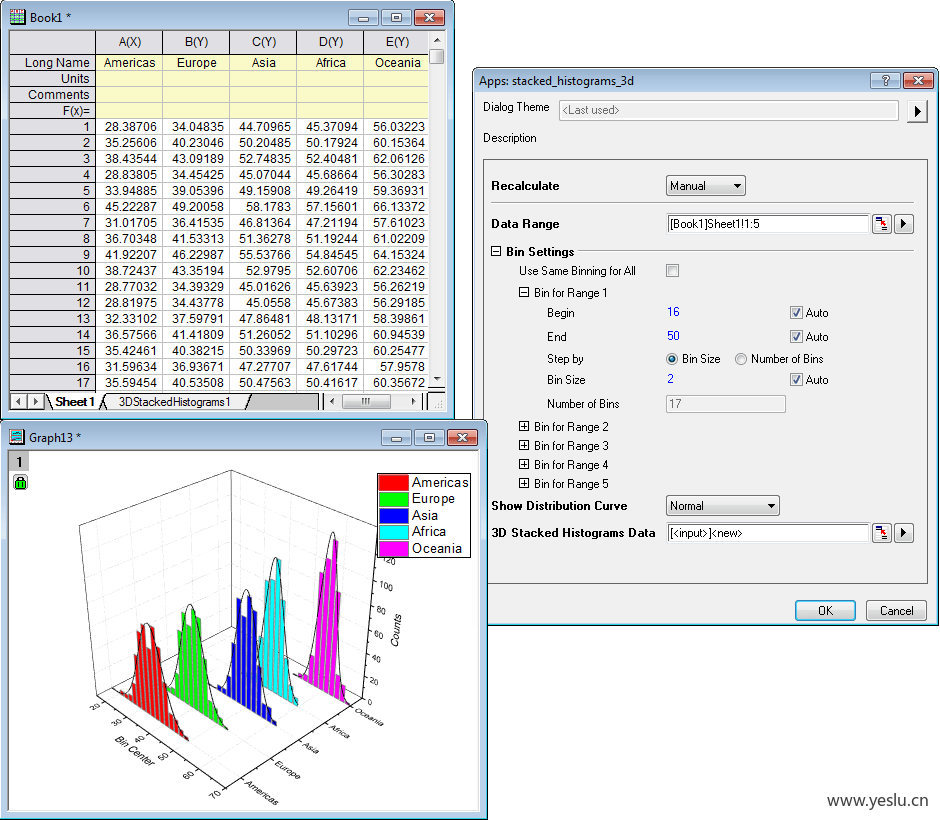
322 - 3D Stacked Histograms
创建具有分布曲线的3D 堆叠直方图。
Create 3D stacked histograms with distribution curves.
- 关键词:分配、曲线、直方图、堆积如山、定制
- Keywords: distribution, curve, histograms, stacked, customize
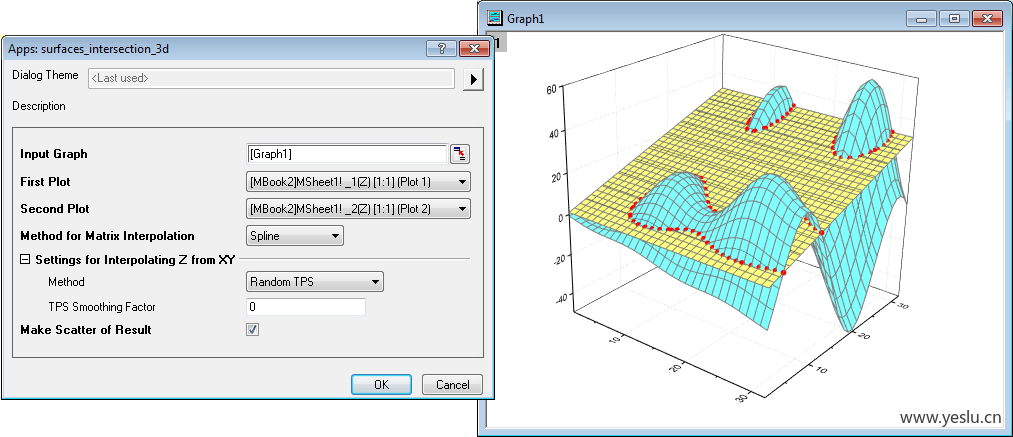
340 - 3D Surfaces Intersection
提取两个三维曲面图的交点。
Extract the intersection points of two 3d surface plots.
- 关键词:阴谋、价值观、第一、矩阵、Xy
- Keywords: plot, values, first, matrix, xy
318 - 3D Wall Profile
从三维表面图创建 XZ 和 YZ 墙壁轮廓
Create XZ and YZ wall profiles from 3D surface plots
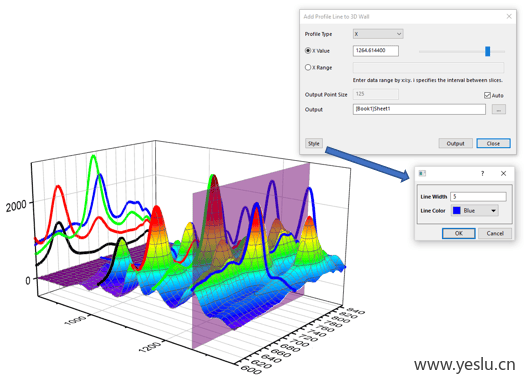
- 关键词:侧写、3D、墙、表面、侧写师
- Keywords: profile, the3d, wall, surface, profileicon
507 - 3D Wind Rose
创建一个3D 风玫瑰图形。
Create a 3D Wind Rose graph.
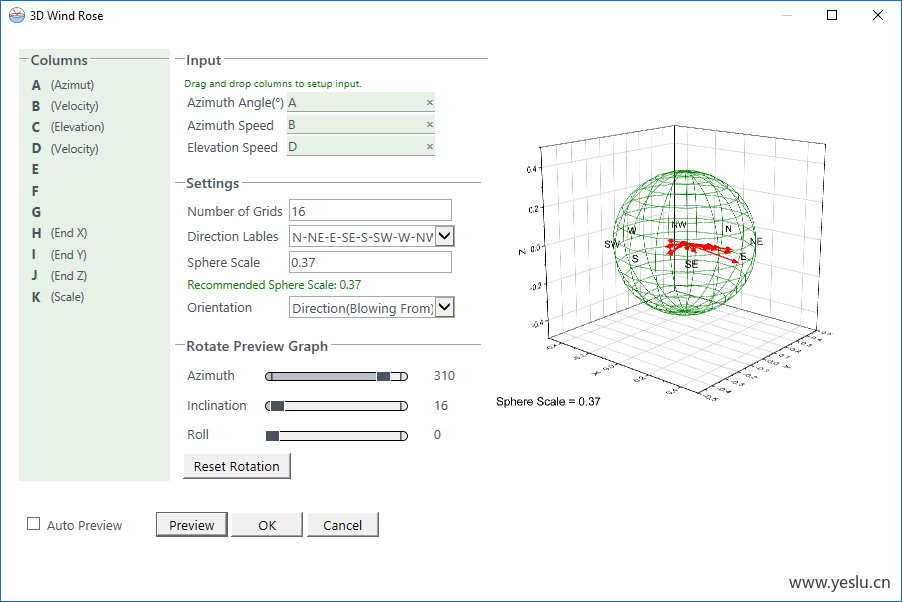
- 关键词:风、方向、具体说明、方向、目的
- Keywords: wind, direction, specify, directions, purpose
614 - Cube Plot
绘制具有指定颜色和透明度的立方体。
Draw cubes with the specified color and transparency.

- 关键词:图表、立方体、对话、颜色、脸
- Keywords: graph, cube, dialog, color, face
301 - Z Profiler
从三维表面图创建特定 Z 值的 XY 数据。
Create XY data at specific Z values from 3D surface plots.
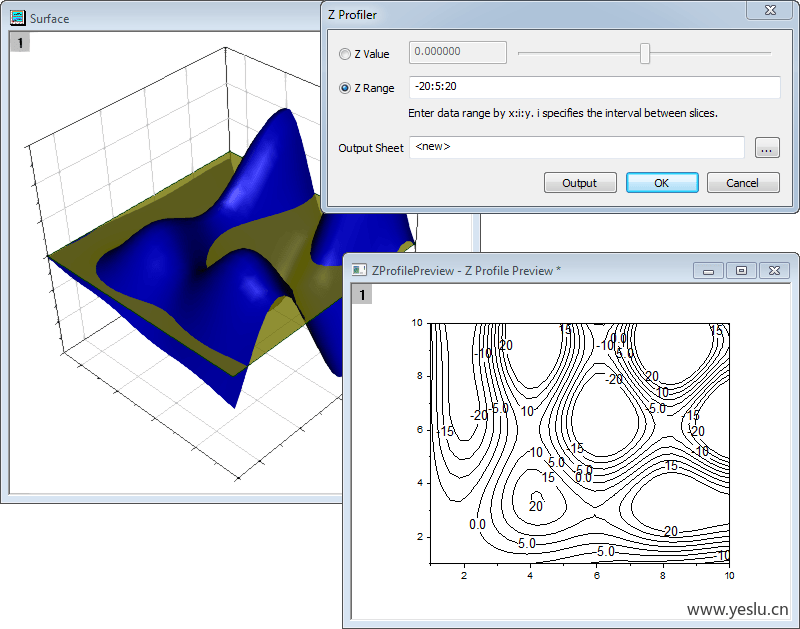
- 关键词:图表、柱子、被创造出来、矩阵、虚拟的
- Keywords: graph, columns, created, matrix, virtual
图像处理与分析
465 - Chebyshev Polynomial Fit
确定第一类切比雪夫多项式的系数。
Determine the coefficients of Chebyshev polynomials of the first kind.
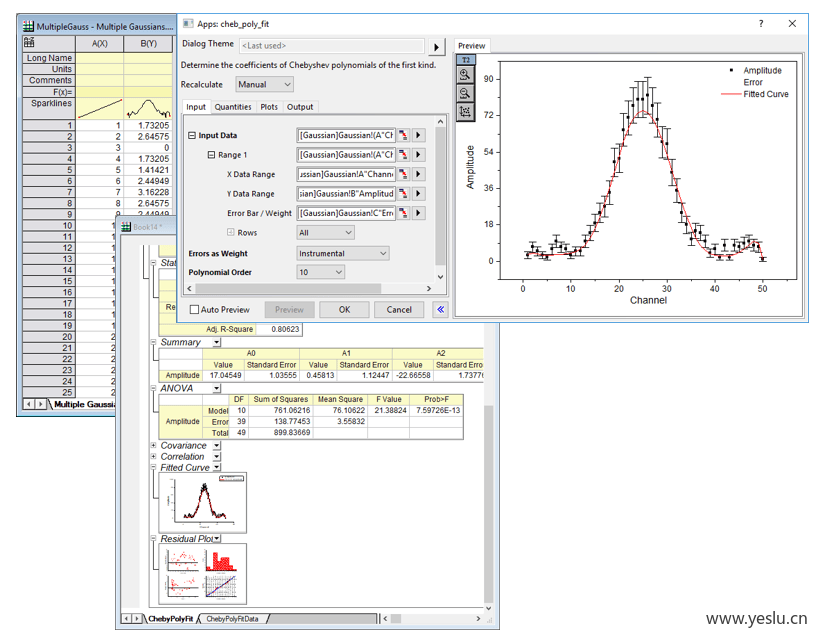
- 关键词:酒吧、我不知道、我不知道、阴谋、多项式
- Keywords: bar, t_, a_, plots, polynomial
334 - Colormap for Map Data
从 Import Shapefile App 中重新排序数据,然后创建色彩映射图。
Reorder the data from Import Shapefile App, and then create colormap map plot.
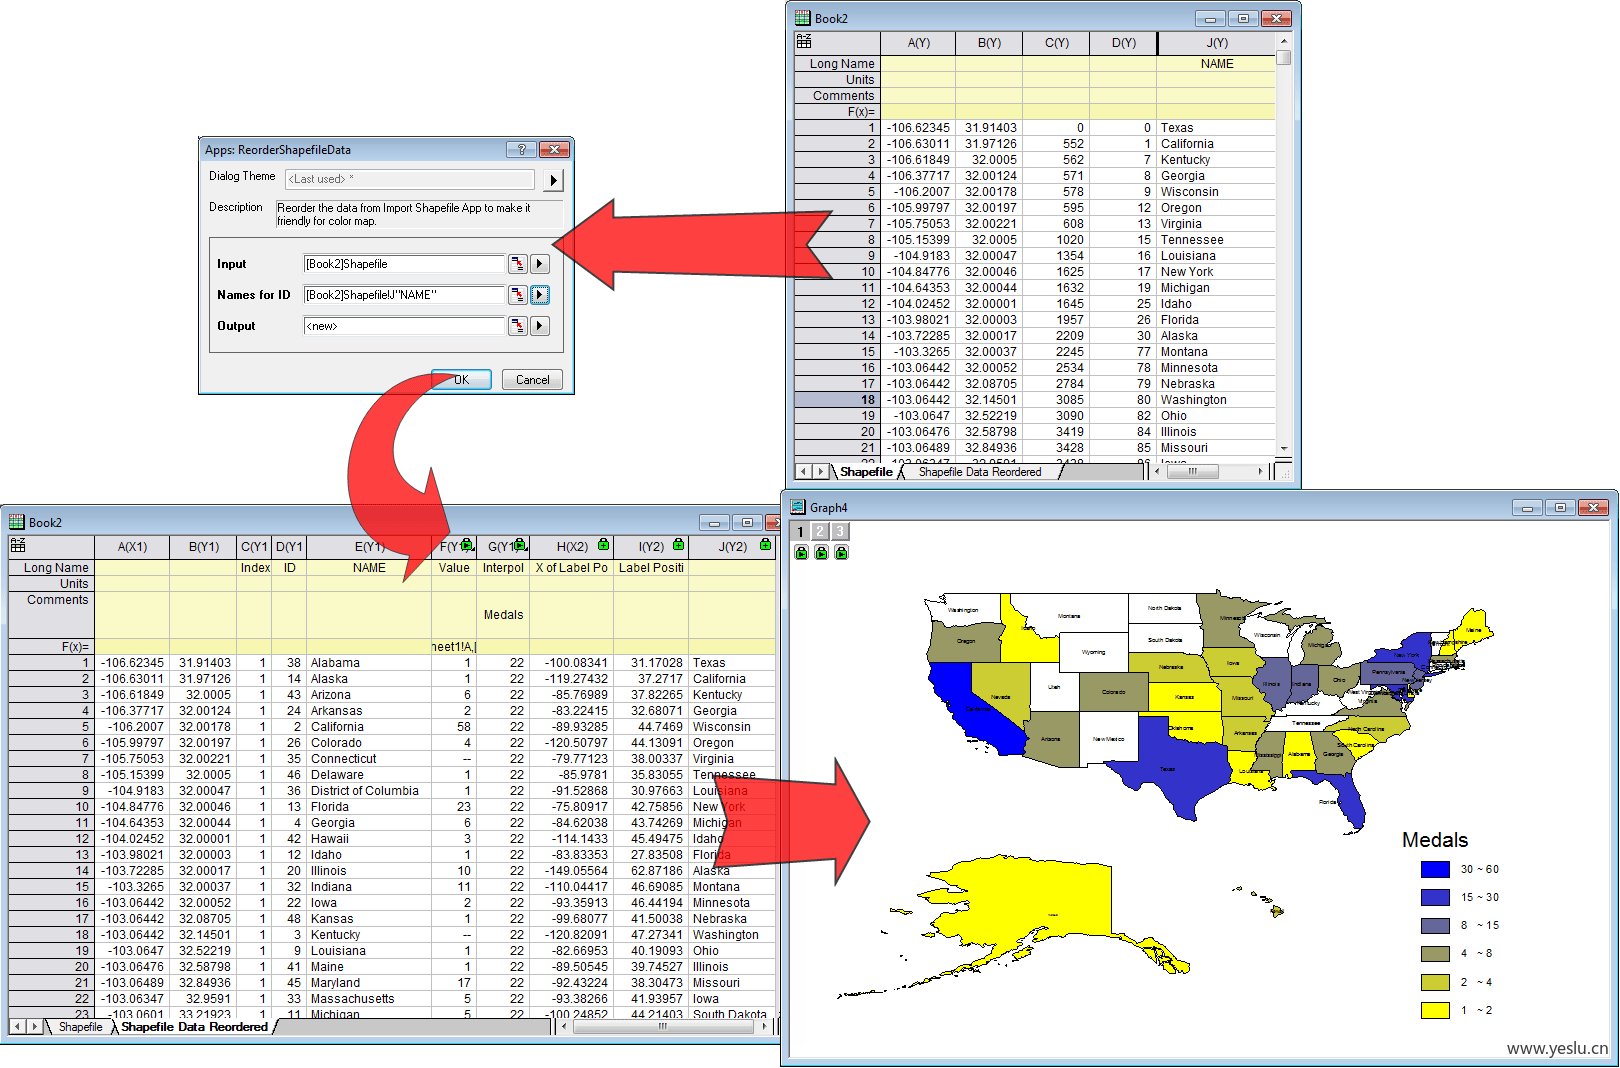
- 关键词:地图、专栏、价值观、Shapefile、工作表
- Keywords: map, column, values, shapefile, worksheet
398 - Data Highlighter
将颜色设置为散点图、线条图或线条 + 符号图的特定区域。
Set color to a specific regions of a scatter plot, line plot or line+symbol plot.
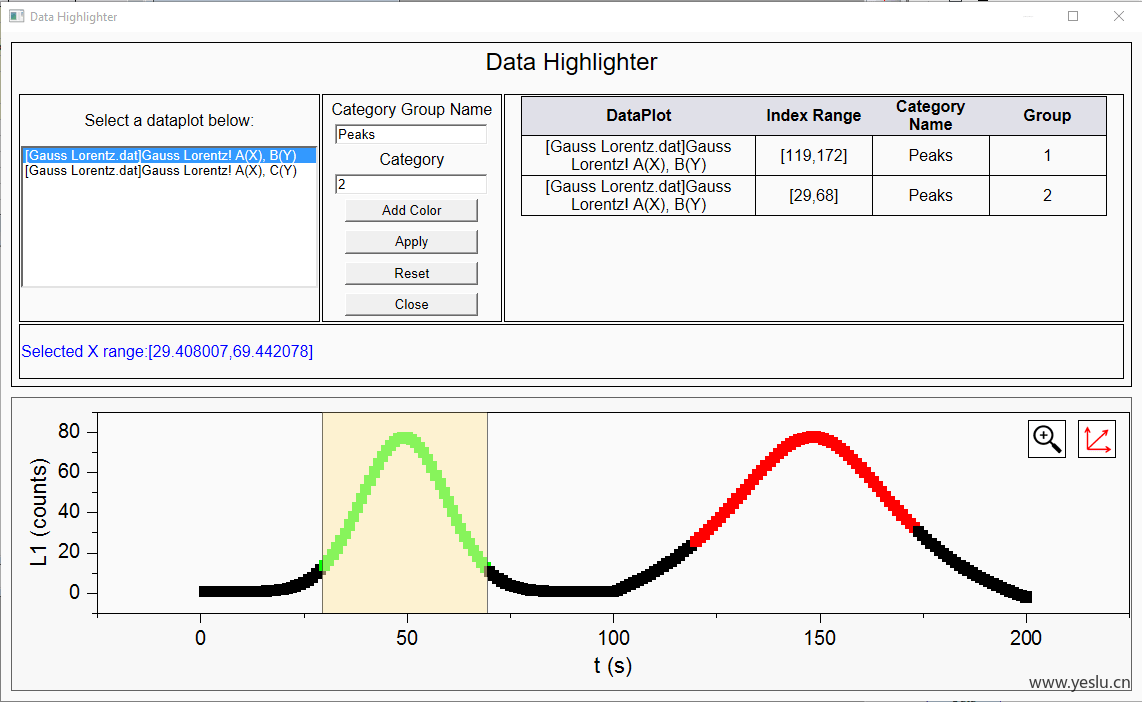
- 关键词:阴谋、颜色、台词、地区、窗户
- Keywords: plot, color, line, region, window
464 - Density Filter
使用彩色比例尺滑块从二维核密度等高线图中过滤数据。
Use color scale slider to filter data from 2D kernel density contour plot.
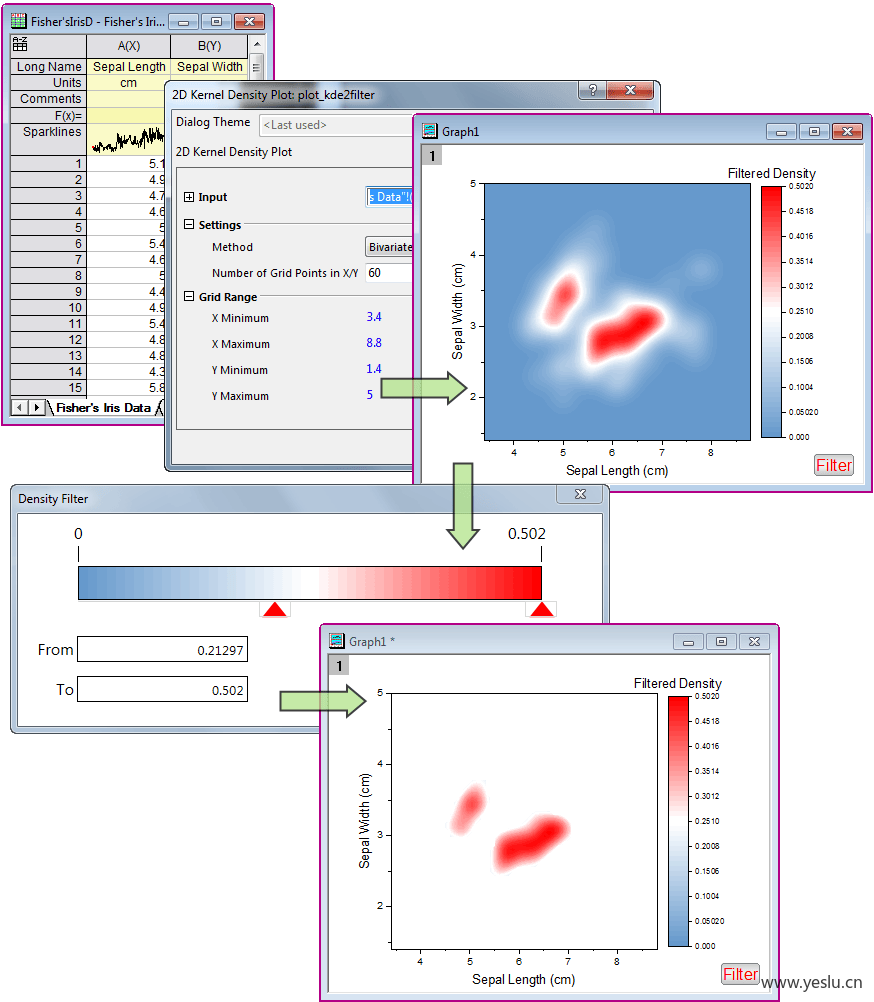
- 关键词:轮廓、密度、价值观、滑球、对话
- Keywords: contour, density, values, slider, dialog
555 - Extract Graph Data
提取或导出图中绘制的数据。
Extract or export data plotted in the graph.
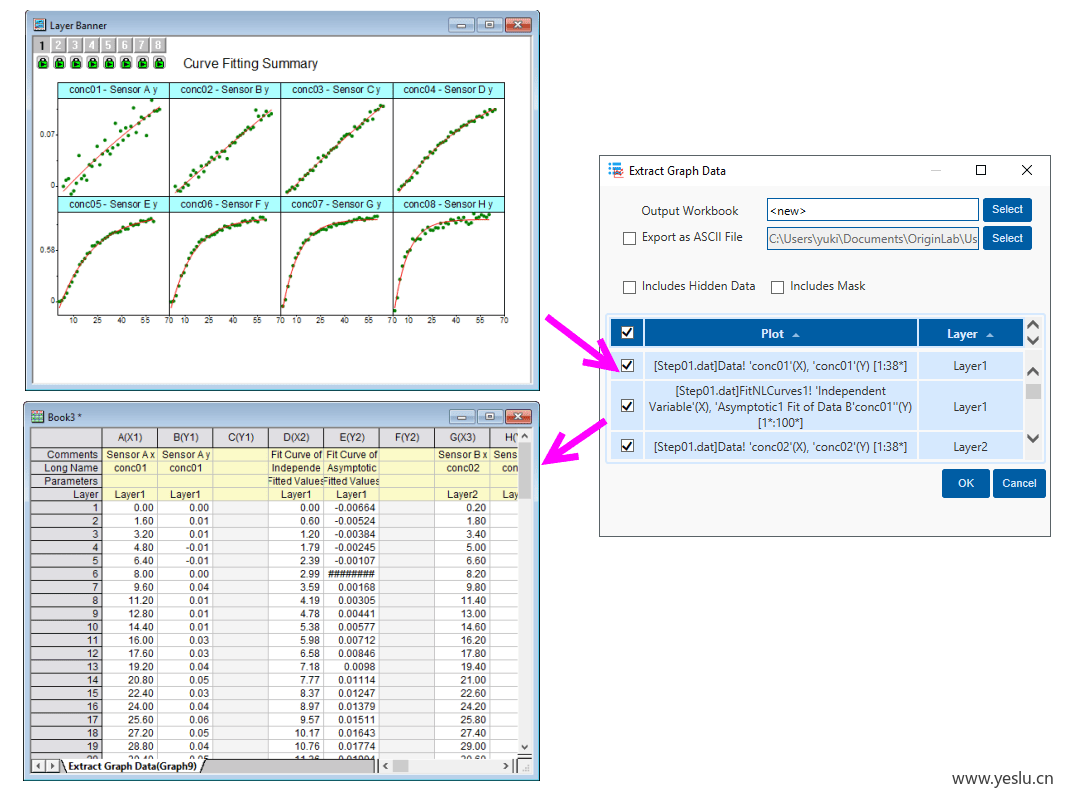
- 关键词:提取物、来源、具体说明、图表、是否
- Keywords: extract, source, specify, graph, whether
945 - Extract XY Data from Graph
从当前图中的所有曲线中提取包括元数据在内的 XY 数据。
Extract XY data including meta data from all curves in the current graph.
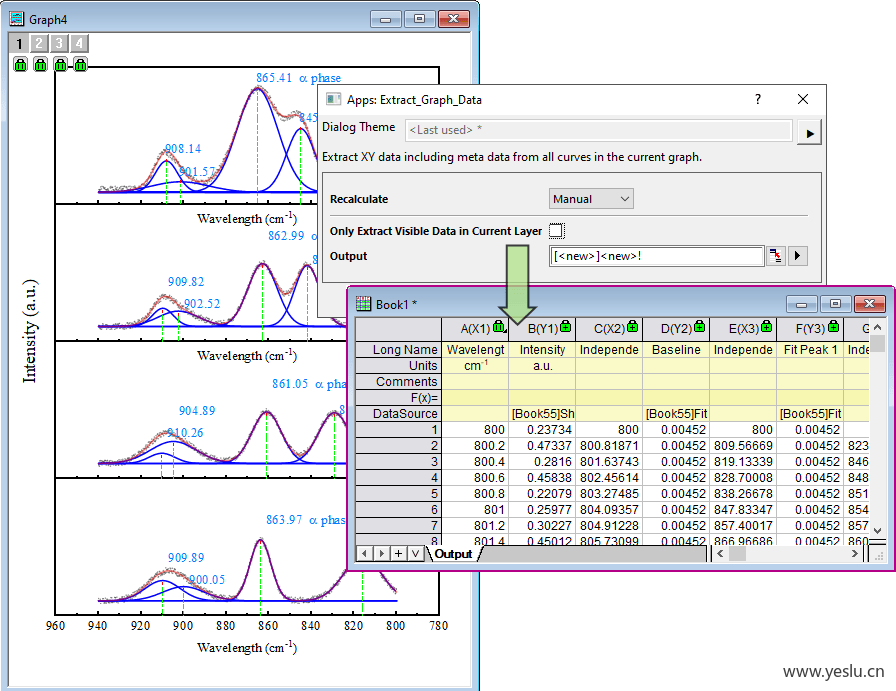
- 关键词:图表、提取物、Xy、看得见、目前
- Keywords: graph, extract, xy, visible, current
412 - FFT Examiner
检查信号的 FFT 频谱。
Examine FFT spectra of signals.
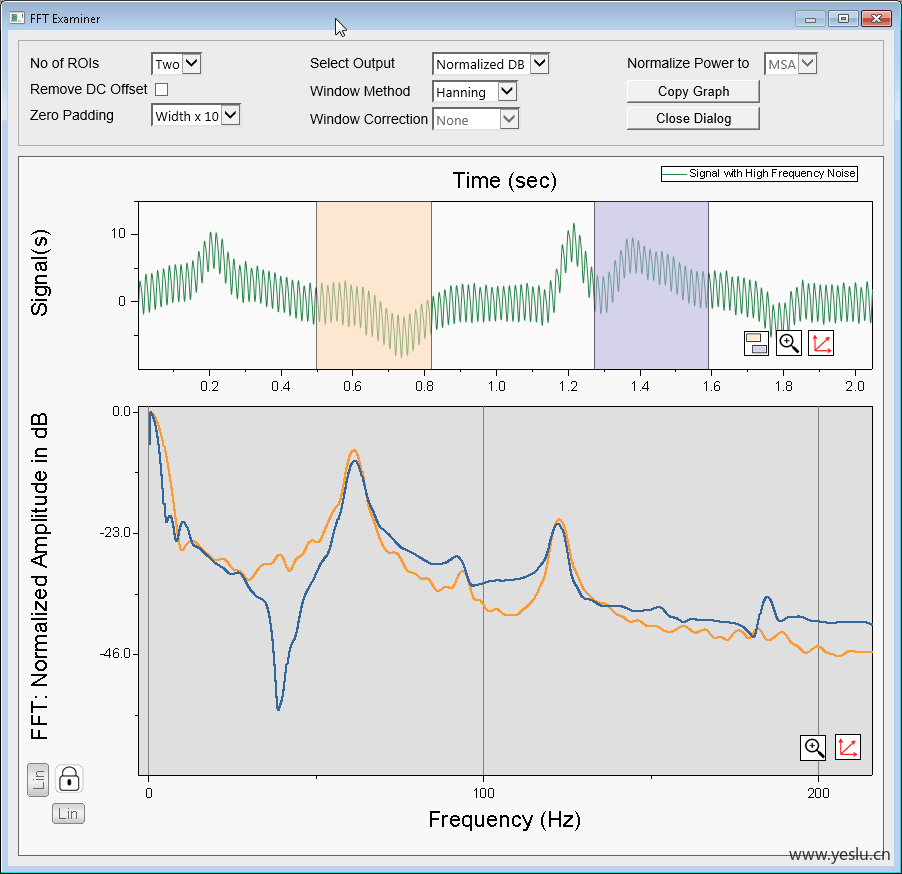
- 关键词:分层、方法、窗户、准备好了、力量
- Keywords: layer, method, window, set, power
483 - Increment List Manager
管理增量列表,并有选择地将它们应用于项目文件中的任何和所有图形。自定义列表并将其保存以备将来使用。
Manage increment lists and selectively apply them to any and all graphs in your project file. Customize lists and save them for future use.
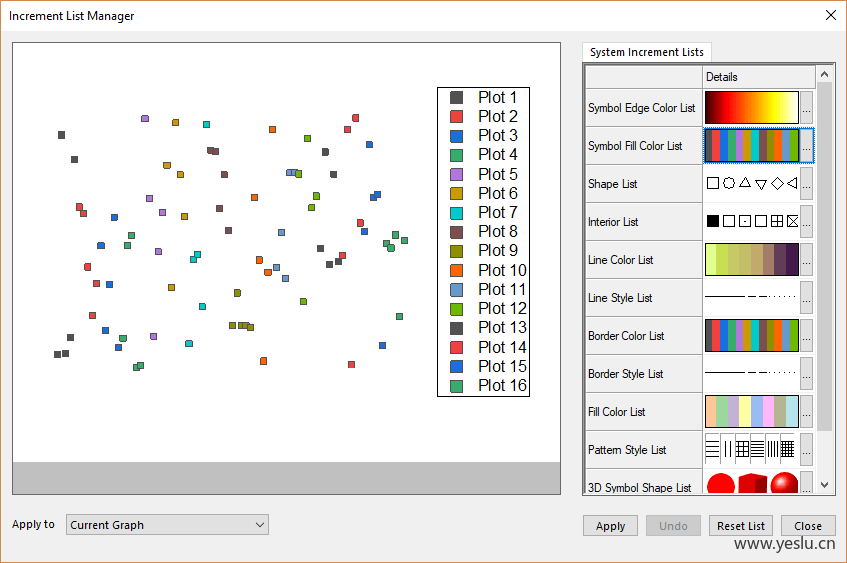
- 关键词:增量、清单、名单、系统、激活
- Keywords: increment, lists, list, system, active
538 - Marginal Abatement Cost Curve
创建边际削减成本曲线。
Create marginal abatement cost curve.
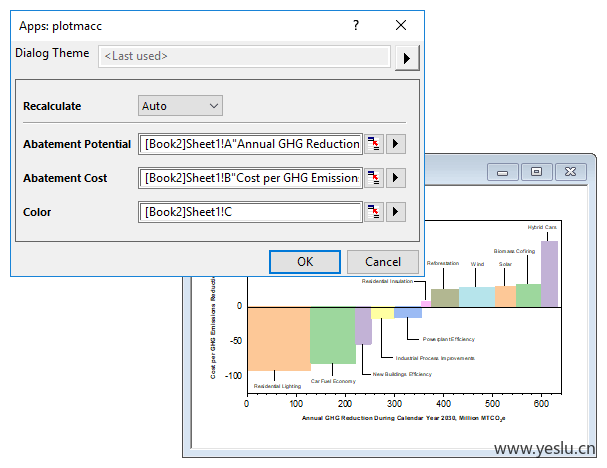
- 关键词:减少、工作表、柱子、曲线、放下
- Keywords: abatement, worksheet, columns, curve, drop
407 - Outlier Detector
在图表或工作表列上标记异常值
Mark outliers on graphs or worksheet columns
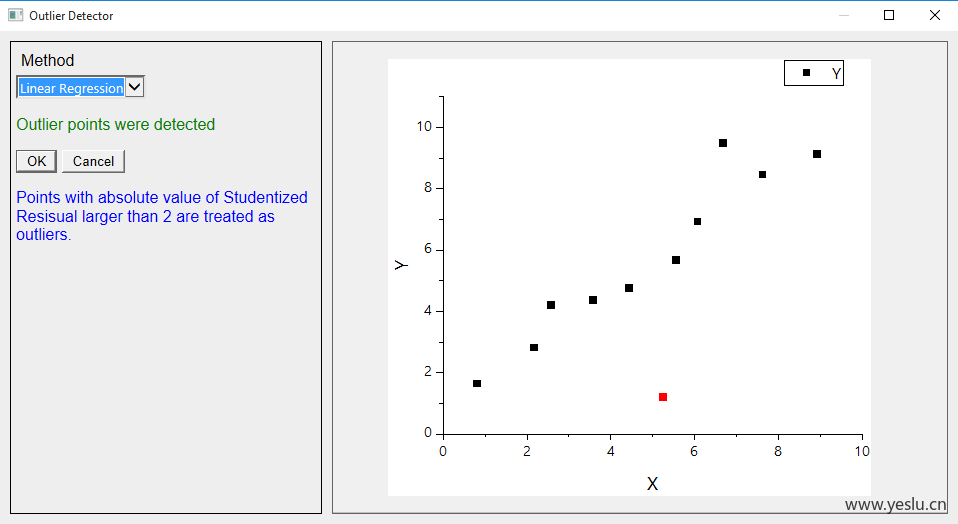
- 关键词:专栏、申请、水平、价值观、准备好了
- Keywords: column, apply, level, values, set
239 - Simple Fit
一种简化的曲线拟合工具。
A simplified tool to perform curve fitting.
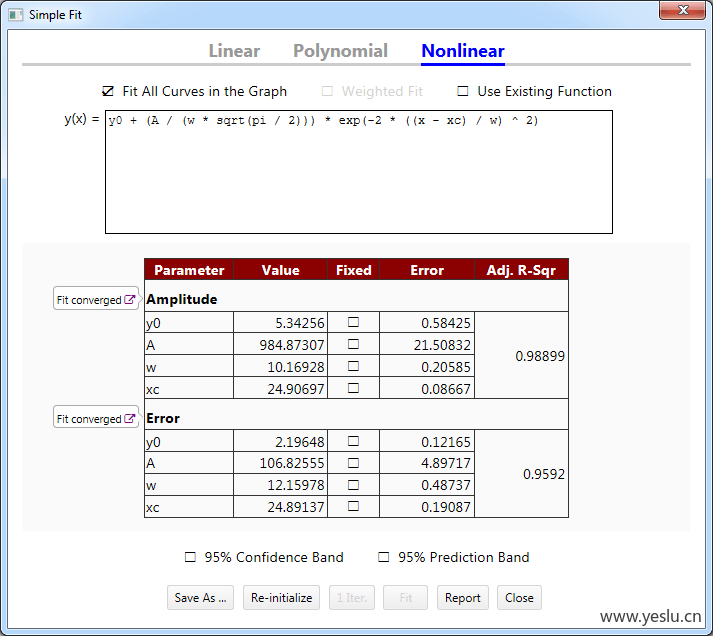
- 关键词:功能、很合适、一、盒子、表演
- Keywords: function, fitting, one, box, perform
934 - Statistical Process Control
统计过程控制(SPC)或统计质量控制(SQC)是统计技术在过程质量测量、监控和控制中的应用。
Statistical process control (SPC) or statistical quality control (SQC) is the application of statistical techniques to measure, monitor and control the quality of a process.
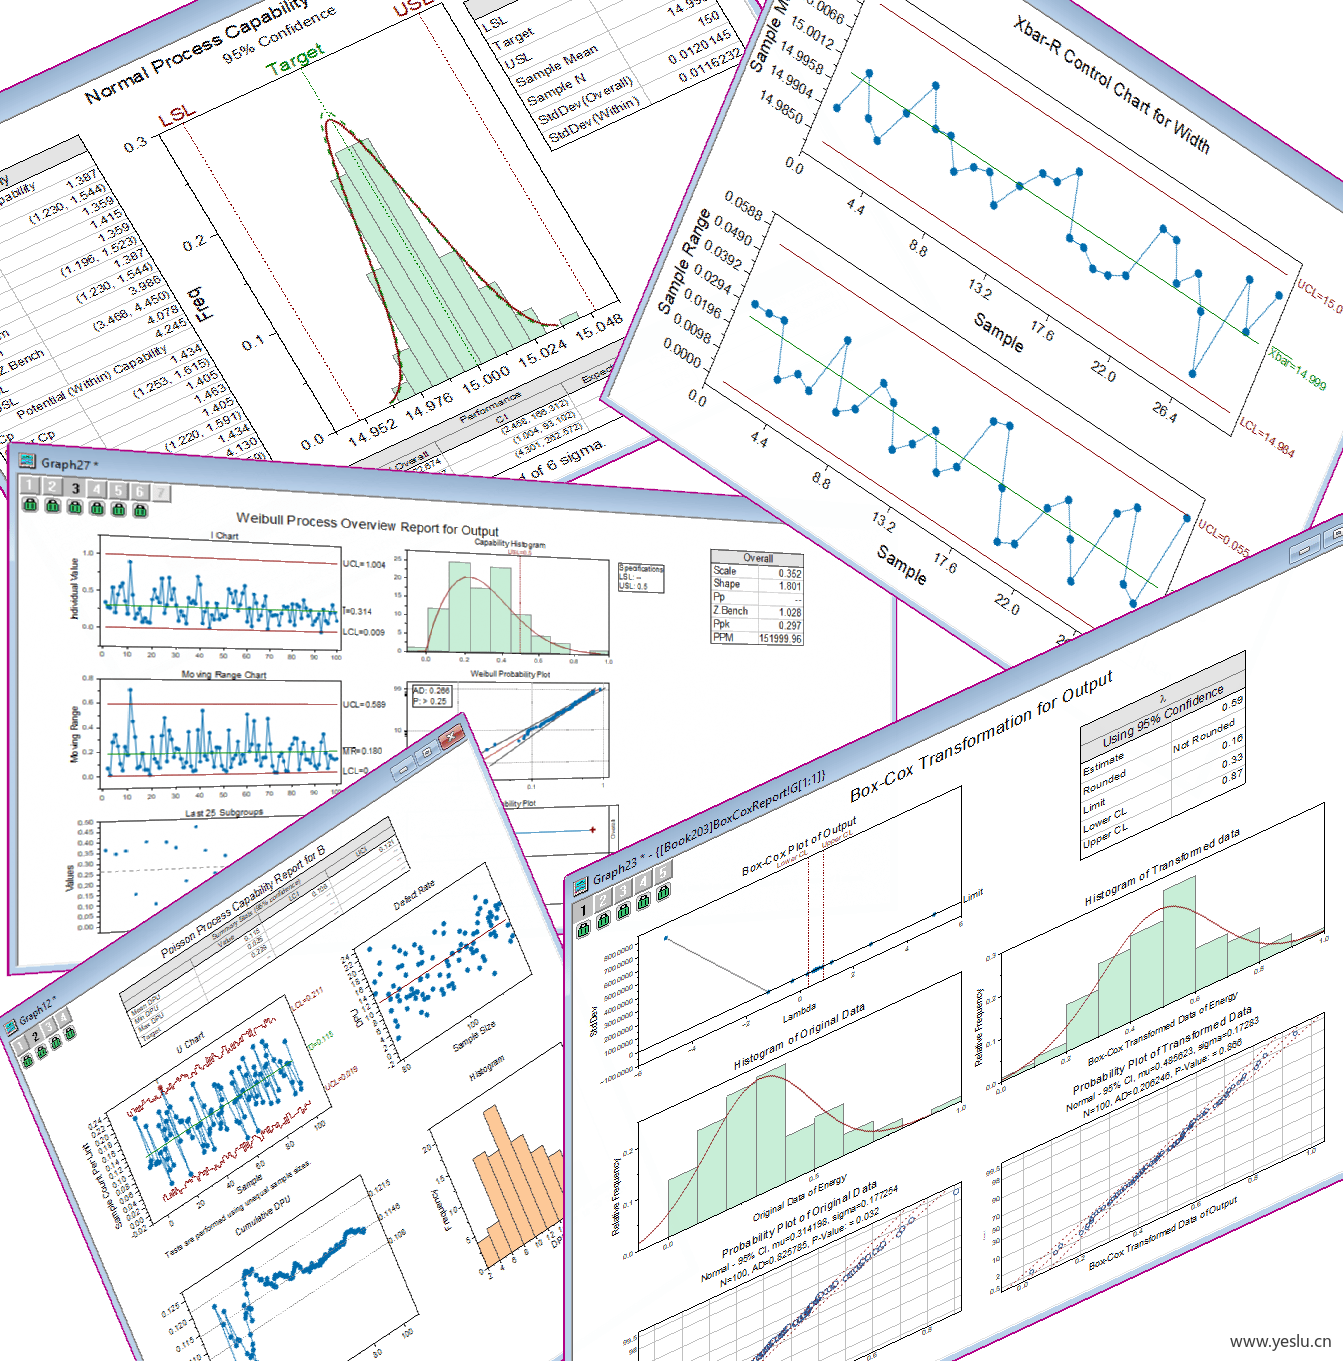
- 关键词:程序、控制、质素、对话、工具
- Keywords: process, control, quality, dialog, tools
227 - Tangent
在数据图的选定点画一条切线。
Draw a tangent line at selected point of a data plot.
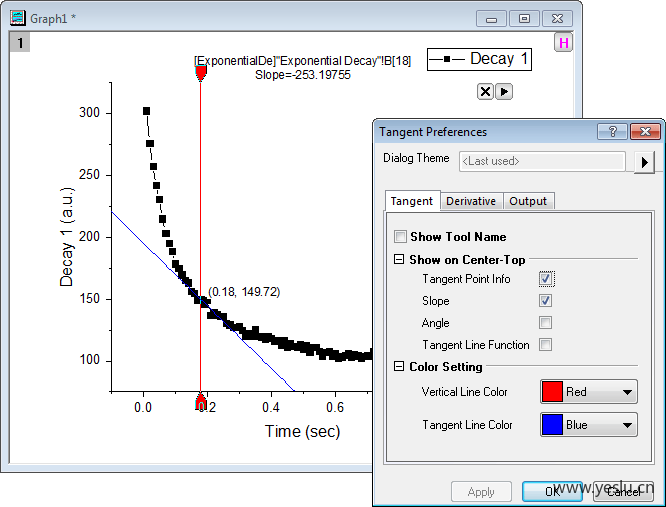
- 关键词:台词、切线、对话、点、打开
- Keywords: line, tangent, dialog, point, open
图形生成与编辑
664 - Animate Plots in Layer
在图层中动画或浏览图形。
Animate or browse plots in a graph layer.
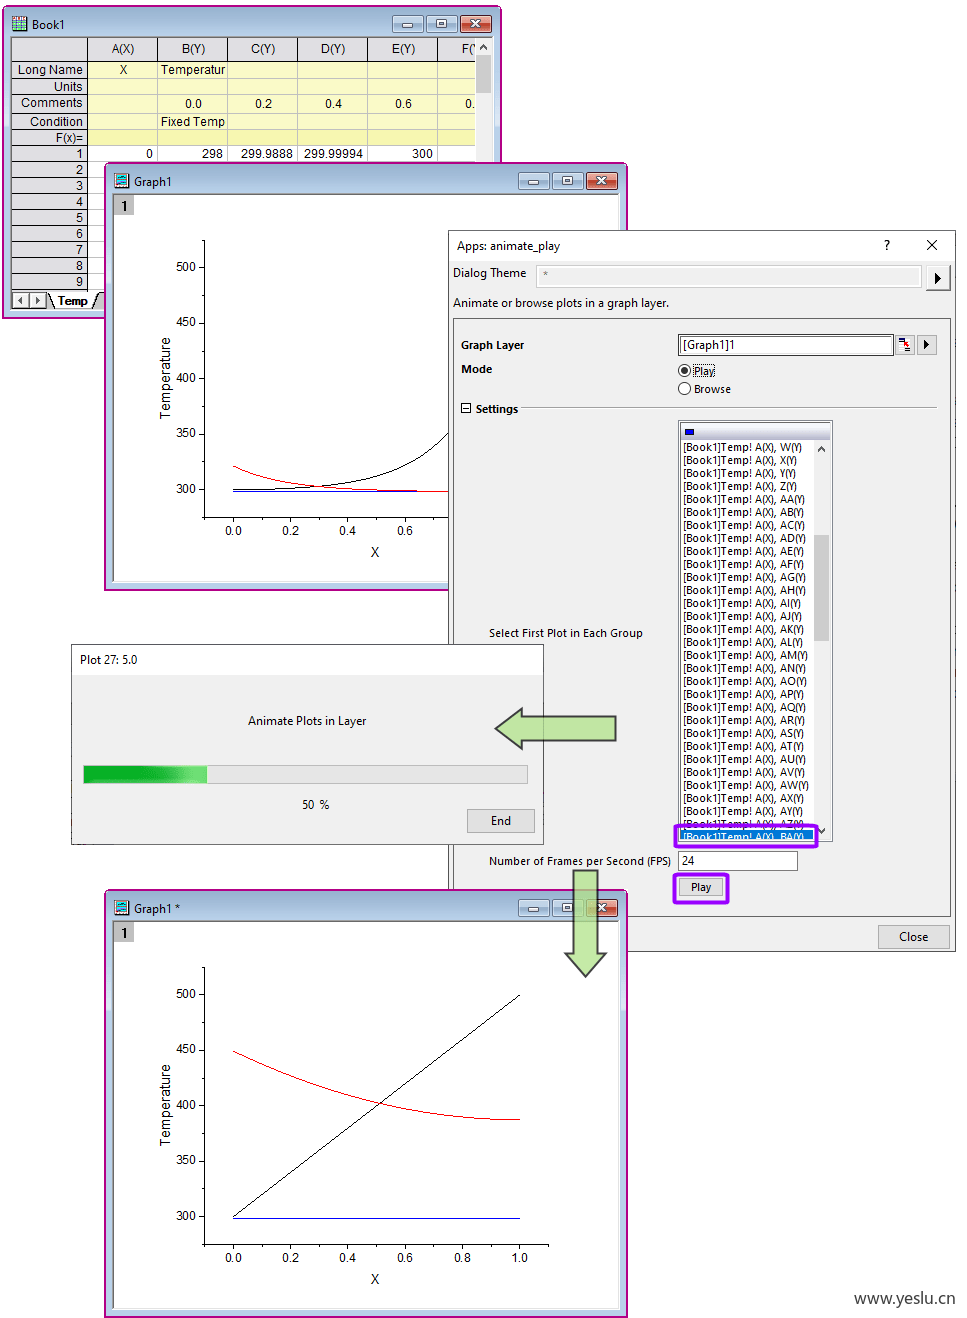
- 关键词:阴谋、表面、分层、动画、相框
- Keywords: plots, surface, layer, animation, frame
470 - Batch Plotting
使用现有的图形、可克隆的模板或从现有的工作表创建图形。
Create graphs using existing graph, cloneable template or from existing sheet.
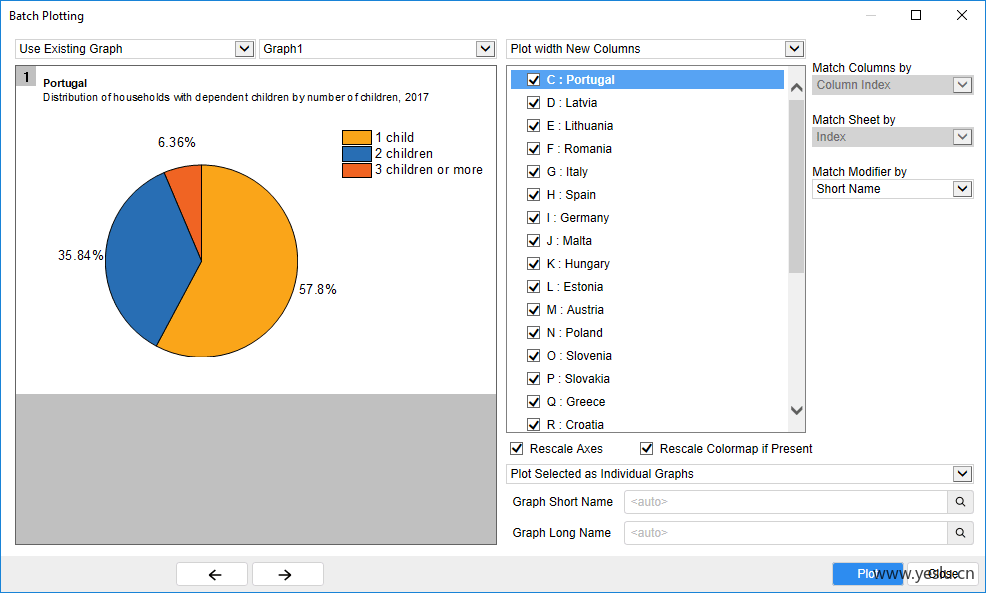
- 关键词:使用、图表、存在、图表、清单
- Keywords: using, graphs, existing, graph, lists
345 - Cloneable Template Plotter
使用与工作表匹配的多个可克隆模板创建图形。
Create graphs using multiple Cloneable Templates that match your worksheet.
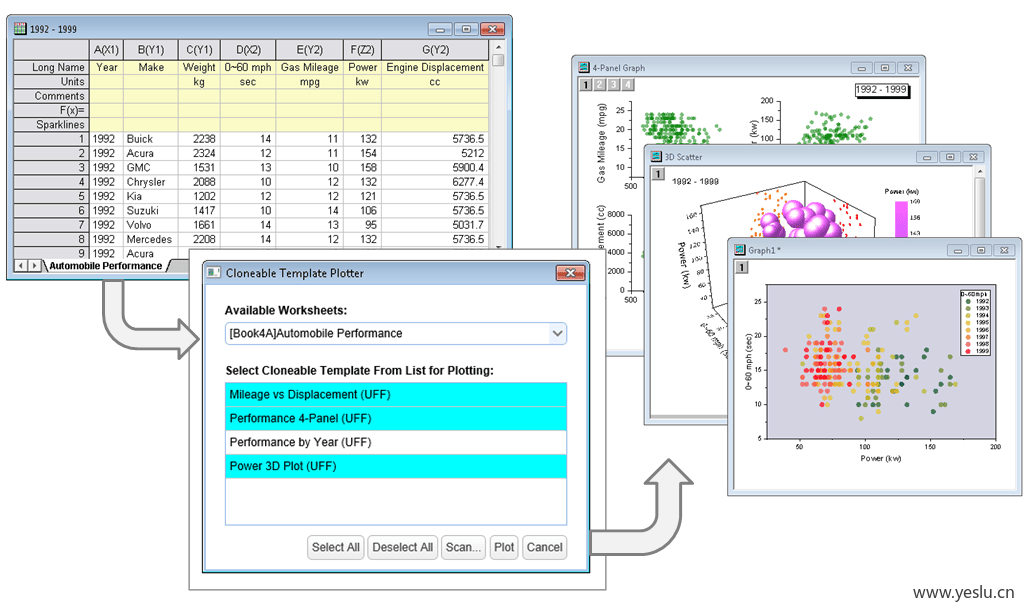
- 关键词:模板、选择、工作表、名单、可克隆的
- Keywords: templates, select, worksheet, list, cloneable
432 - Font Changer
批处理修改图形中的字体。
Batch modify fonts in a graph.
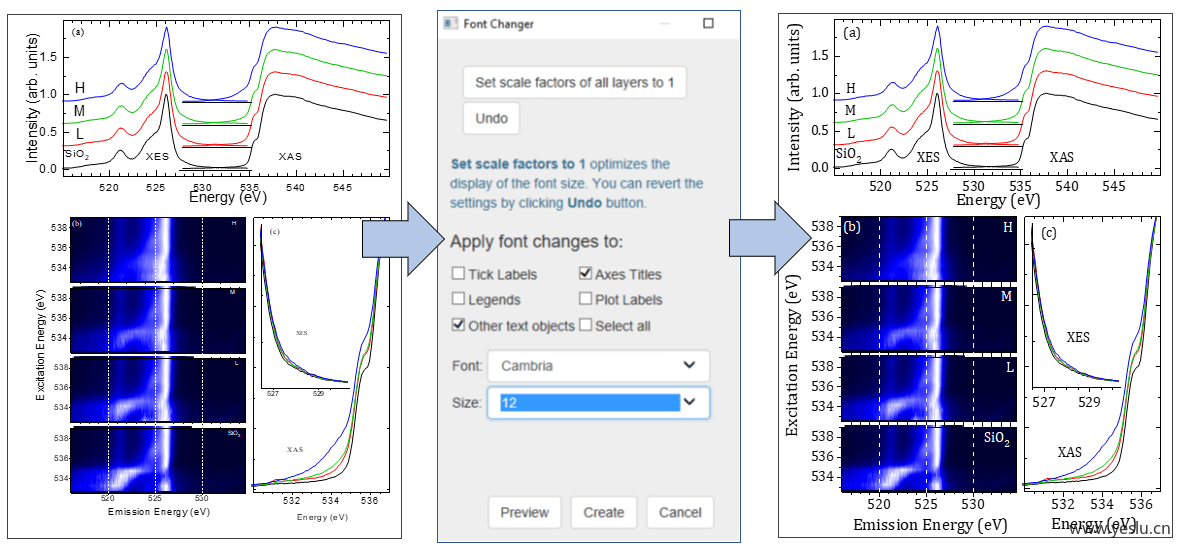
- 关键词:尺寸、字体、准备好了、对话、图表
- Keywords: size, font, set, dialog, graph
482 - Graph Anim
动画图形与许多不同的效果,并导出为动画 GIF 或 MP4
Animate graphs with many different effects and export as animated GIF or MP4
- 关键词:Gif、充满活力、动画、数据图、差不多
- Keywords: gif, animated, animation, dataplot, close
638 - Graph Annotator
在带标记和标签的图表上添加 XY 点
Add XY points on a graph with a marker and label
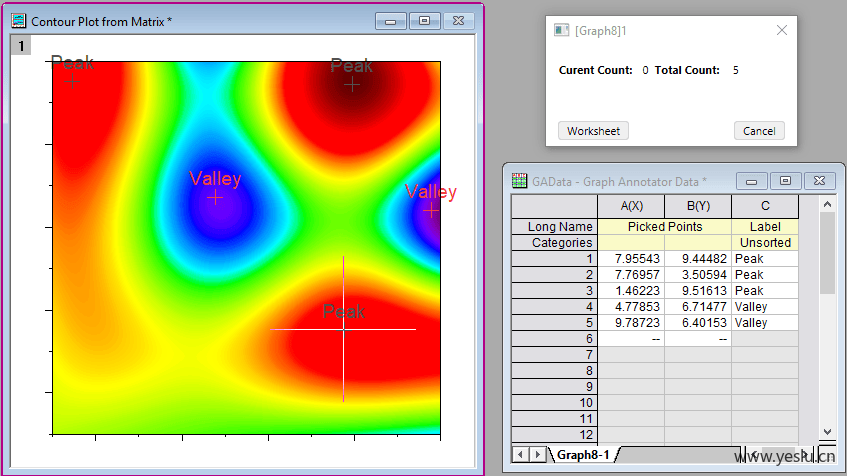
- 关键词:图表、画廊窗户、应用程序、对话、分数
- Keywords: graph, gallerywindow, theapps, dialog, points
445 - Graph Maker
通过拖放操作交互式创建具有分组数据的图形。
Create graph with grouped data interactively by drag-and-drop.
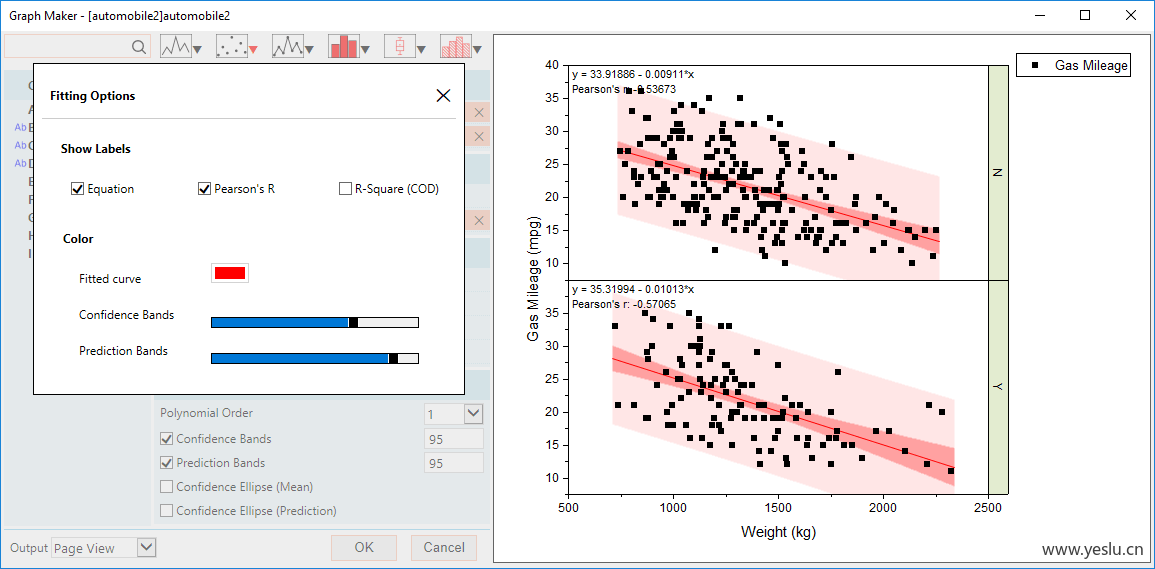
- 关键词:柱子、放下、图表、很合适、拖
- Keywords: columns, drop, graph, fitting, drag
374 - Send Graphs to PowerPoint
将图形作为图片或嵌入对象发送到 PowerPoint。
Send graphs to PowerPoint as picture or embedded object.
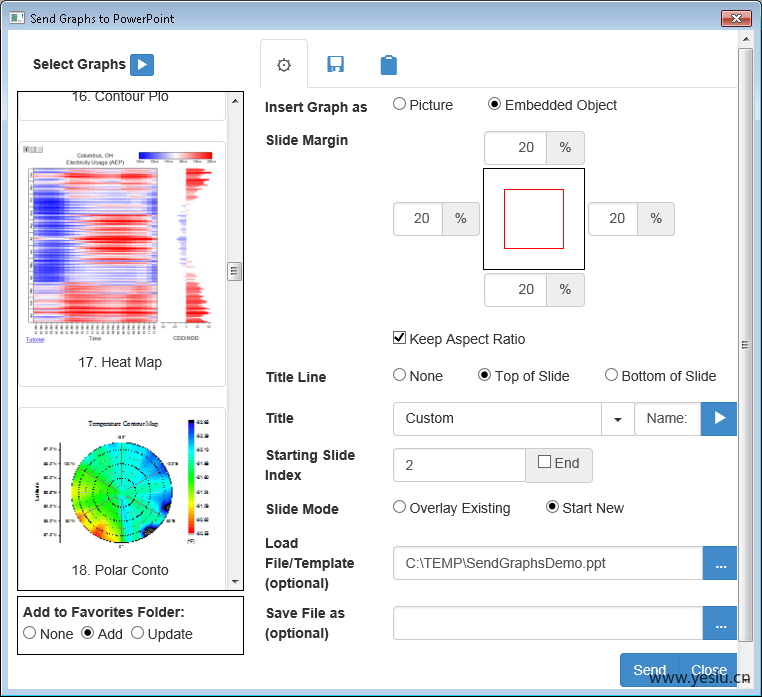
- 关键词:图表、图表、名单、幻灯片、幻灯片
- Keywords: graphs, graph, list, slide, powerpoint
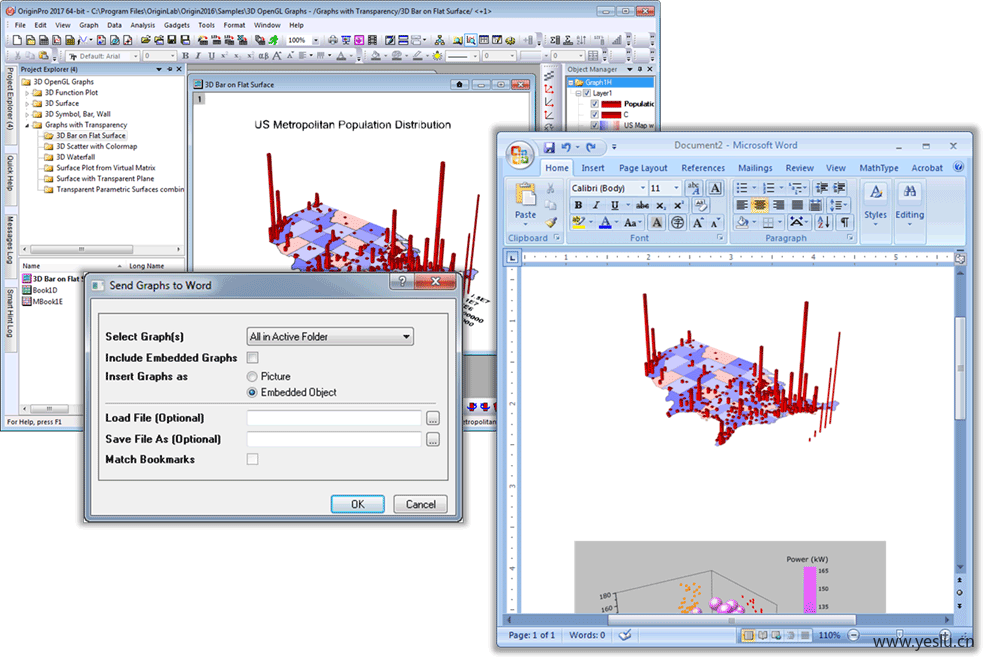
238 - Send Graphs to Word
将选定的 Origin 图表发送到 Microsoft Word。
Send selected Origin graphs to Microsoft Word.
- 关键词:字、图表、文件、打开了、纸条
- Keywords: word, graphs, document, opened, note
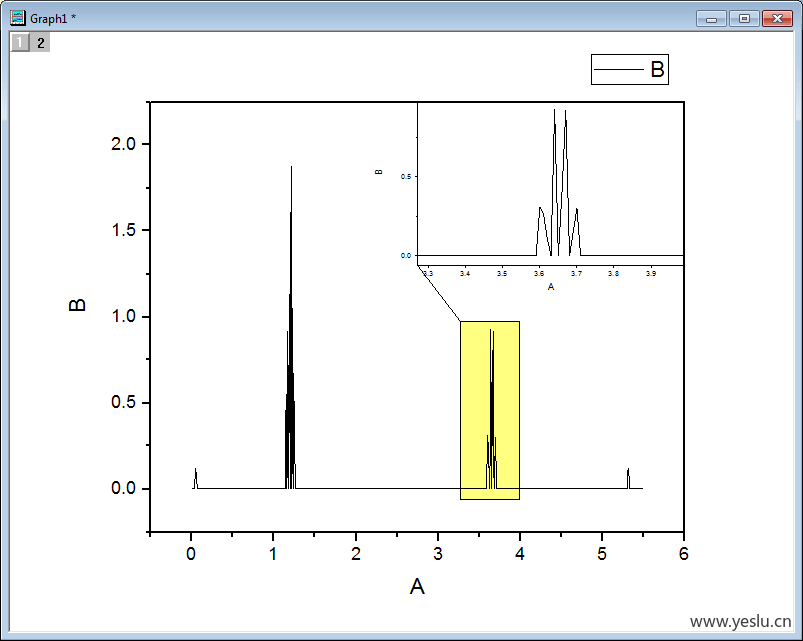
310 - Zoomed Inset
通过交互式缩放到一个插图中来添加一个插图。
Add an inset plot by interactively zooming into a plot.
- 关键词:分层、插图、国王、图表、阴谋
- Keywords: layer, inset, roi, graph, plot
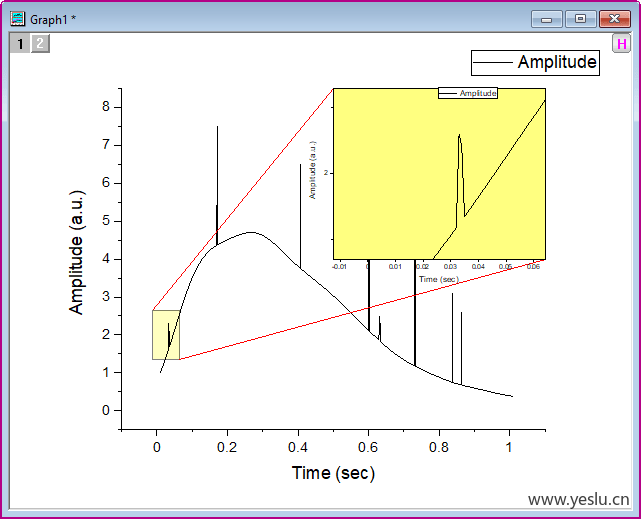
572 - Zoomed Inset Plus
插图层缩放图形。
Zoom graph in inset layer.
- 关键词:分层、长方形、插图、颜色、表演
- Keywords: layer, rectangle, inset, color, show
其他工具
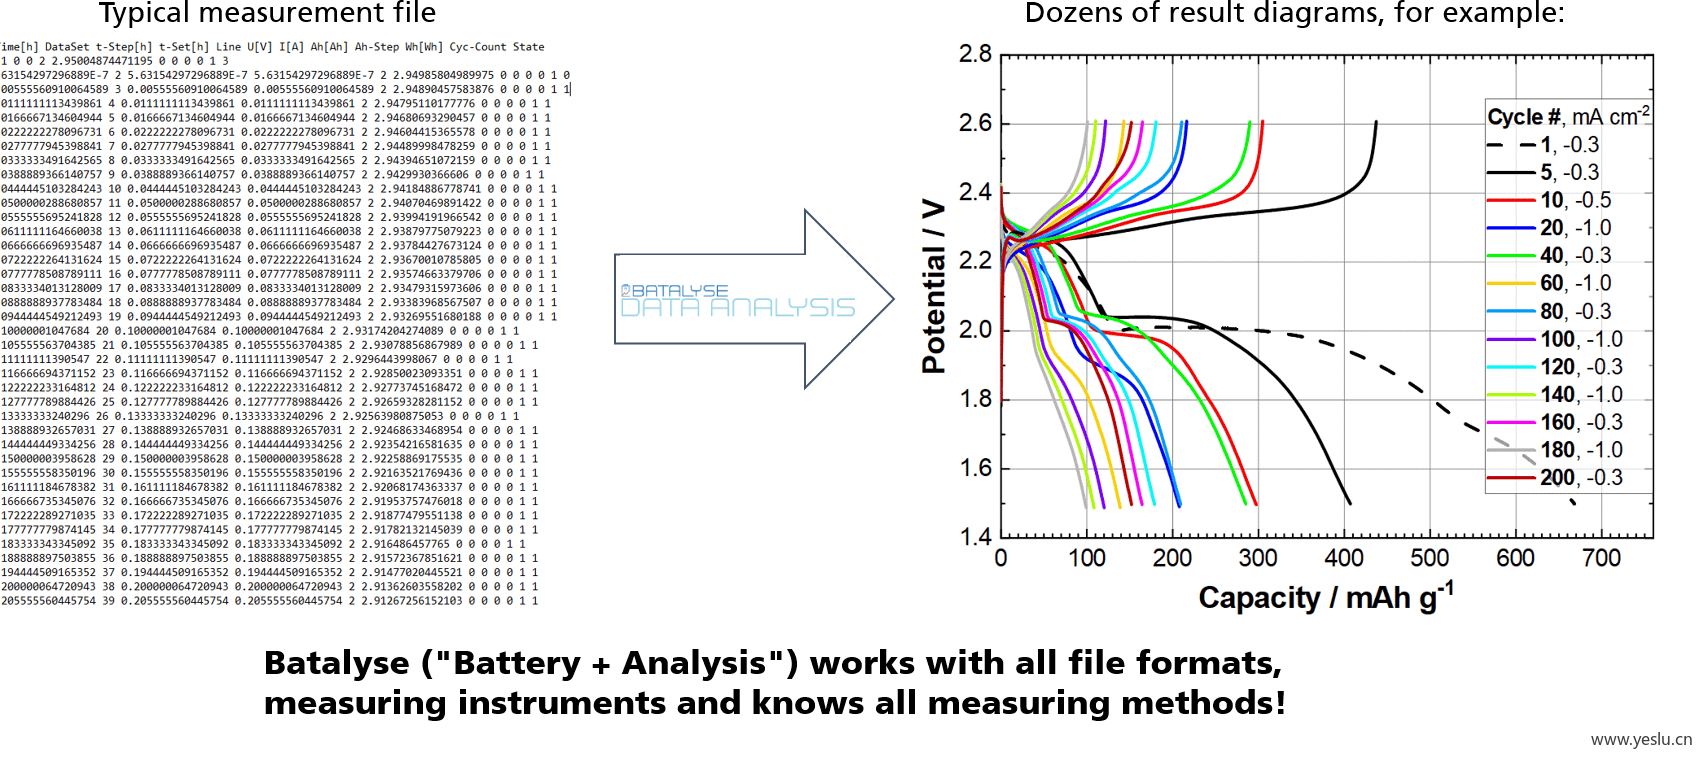
564 - Batalyse
Batalyse-Data Analysis 是独立于测试装置和文件结构的电池和燃料电池测量数据的通用评估程序。使用数据分析,您可以比以前更快更好地评估测量数据!
Batalyse - Data Analysis is a universal evaluation program for measurement data of batteries and fuel cells independent of the test device and file structure. With Data Analysis you evaluate measured data faster and better than ever before!
- 关键词:Batalyse、测试、分析、图表、测量
- Keywords: batalyse, test, analysis, diagrams, measurement
611 - Common Bar Width
帮助在不同的图形中共享条形图的宽度和间隙。
Help to share bar width and gap in different graphs.
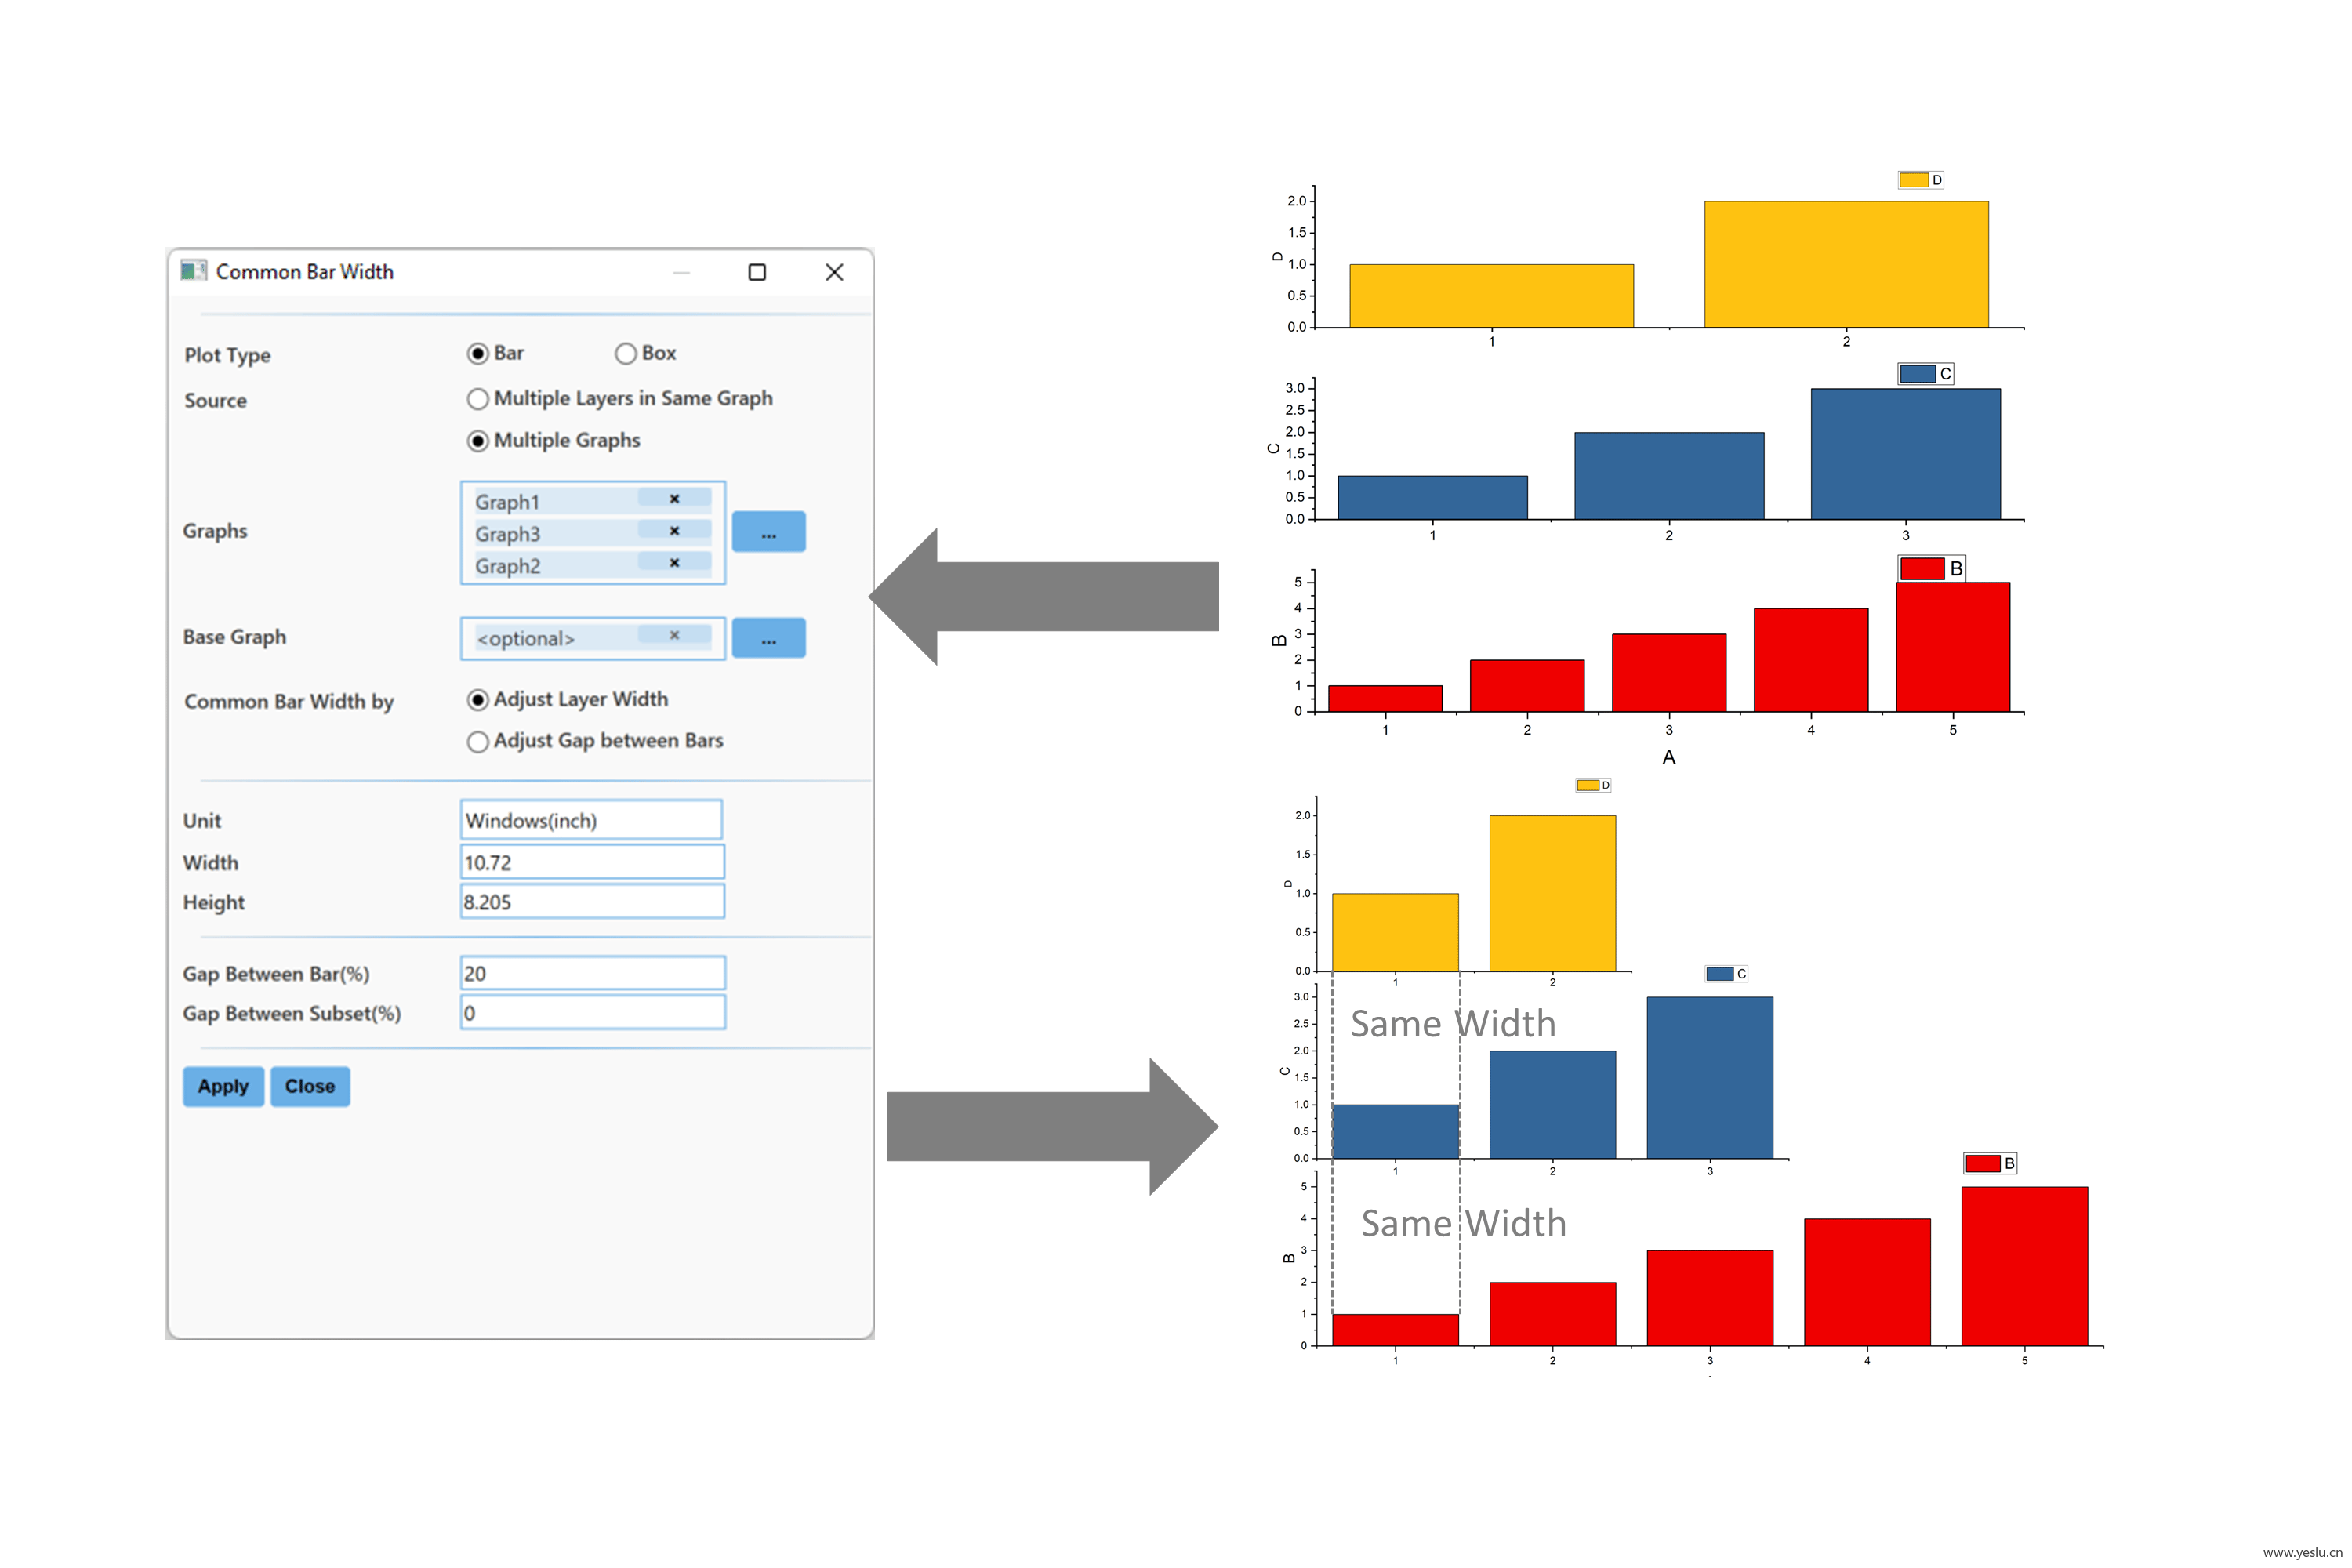
- 关键词:图表、酒吧、间隙、纽扣、选择
- Keywords: graph, bar, gap, button, select
221 - LaTeX
在工作表单元格、图轴标题、图例和文本标签中插入 LaTeX 对象。
Insert LaTeX objects in worksheet cells, graph axes titles, legends and text labels.
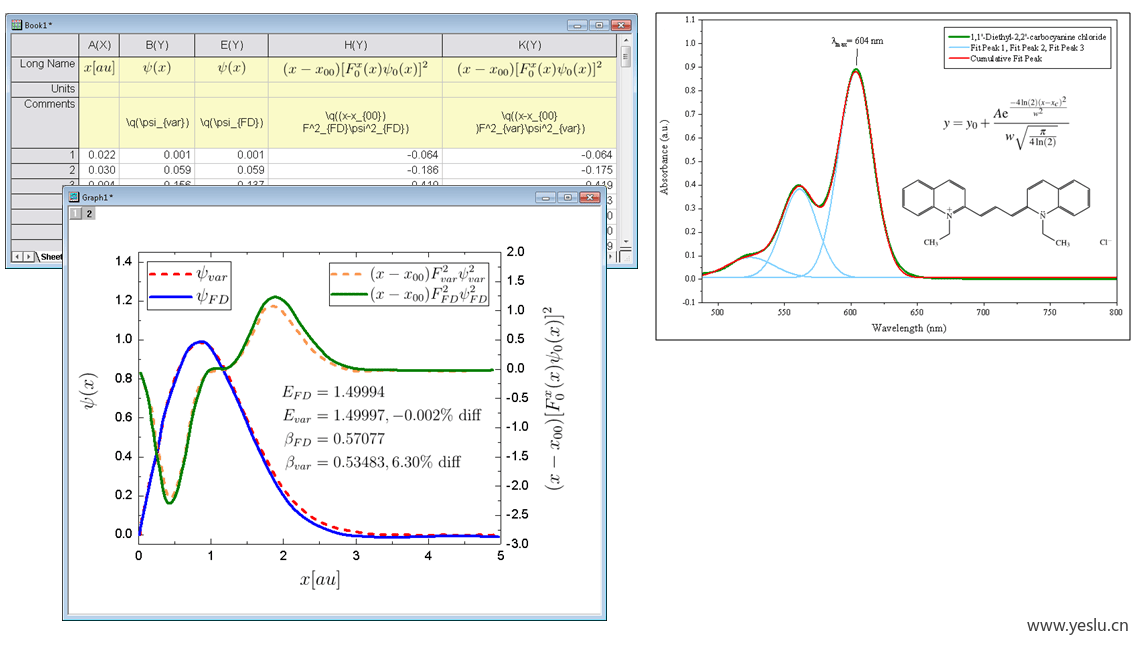
- 关键词:乳胶、版本、图表、Miktex、博客
- Keywords: latex, version, graph, miktex, blog
263 - Layer Stack Manager
在活动图层之前或之后插入一个图层,或者删除活动图层或堆叠图形中的选定图层。
Insert a layer before or after the active layer, or delete the active layer or selected layers in a stacked graph.
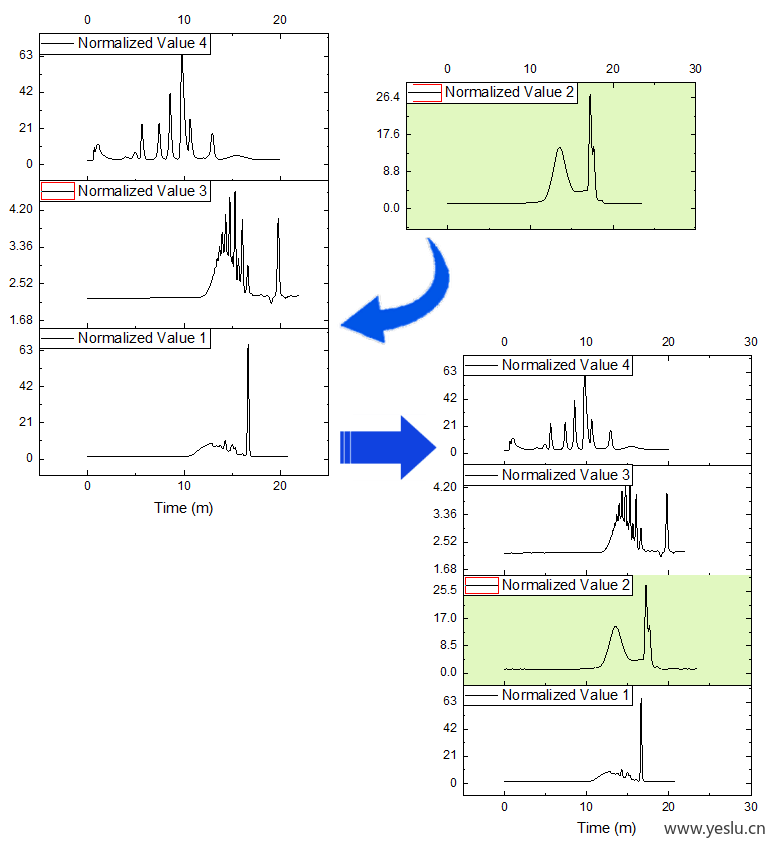
- 关键词:分层、图表、堆积如山、纽扣、选定
- Keywords: layer, graph, stacked, button, selected
476 - Theme Preview
预览和应用图形主题。
Preview and apply graph themes.
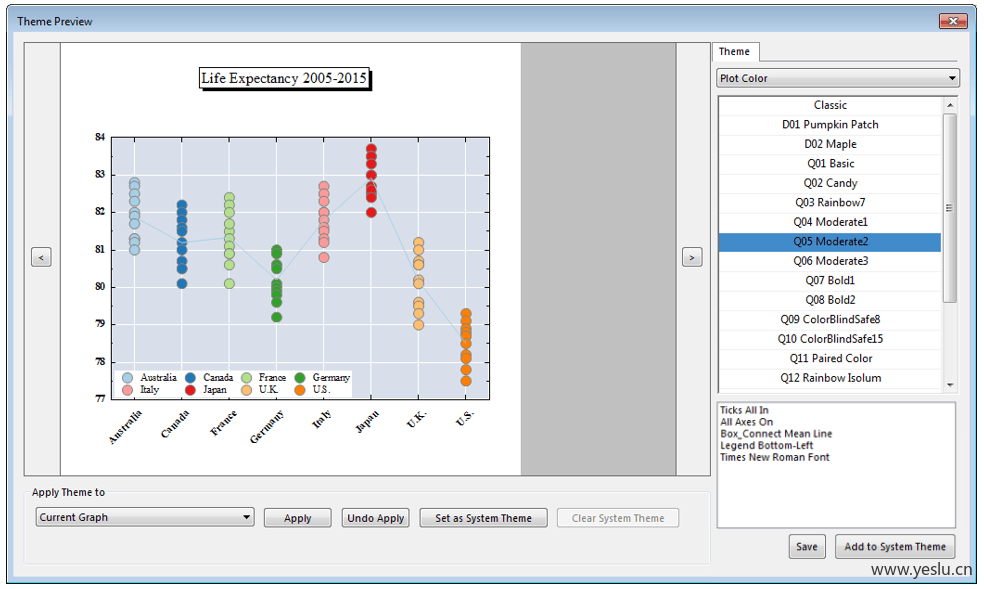
- 关键词:主题、纽扣、图表、主题、应用
- Keywords: theme, button, graph, themes, applied