Origin 例图分析 - Fan Performance Curves
前言
在 Origin 的 Learning Center 中有这样一张风扇性能曲线图,但对于非专业人士来说解读曲线会有些困难。以下分析结果采用 ChatGPT o1 分析,经人工修正后给出。
解读
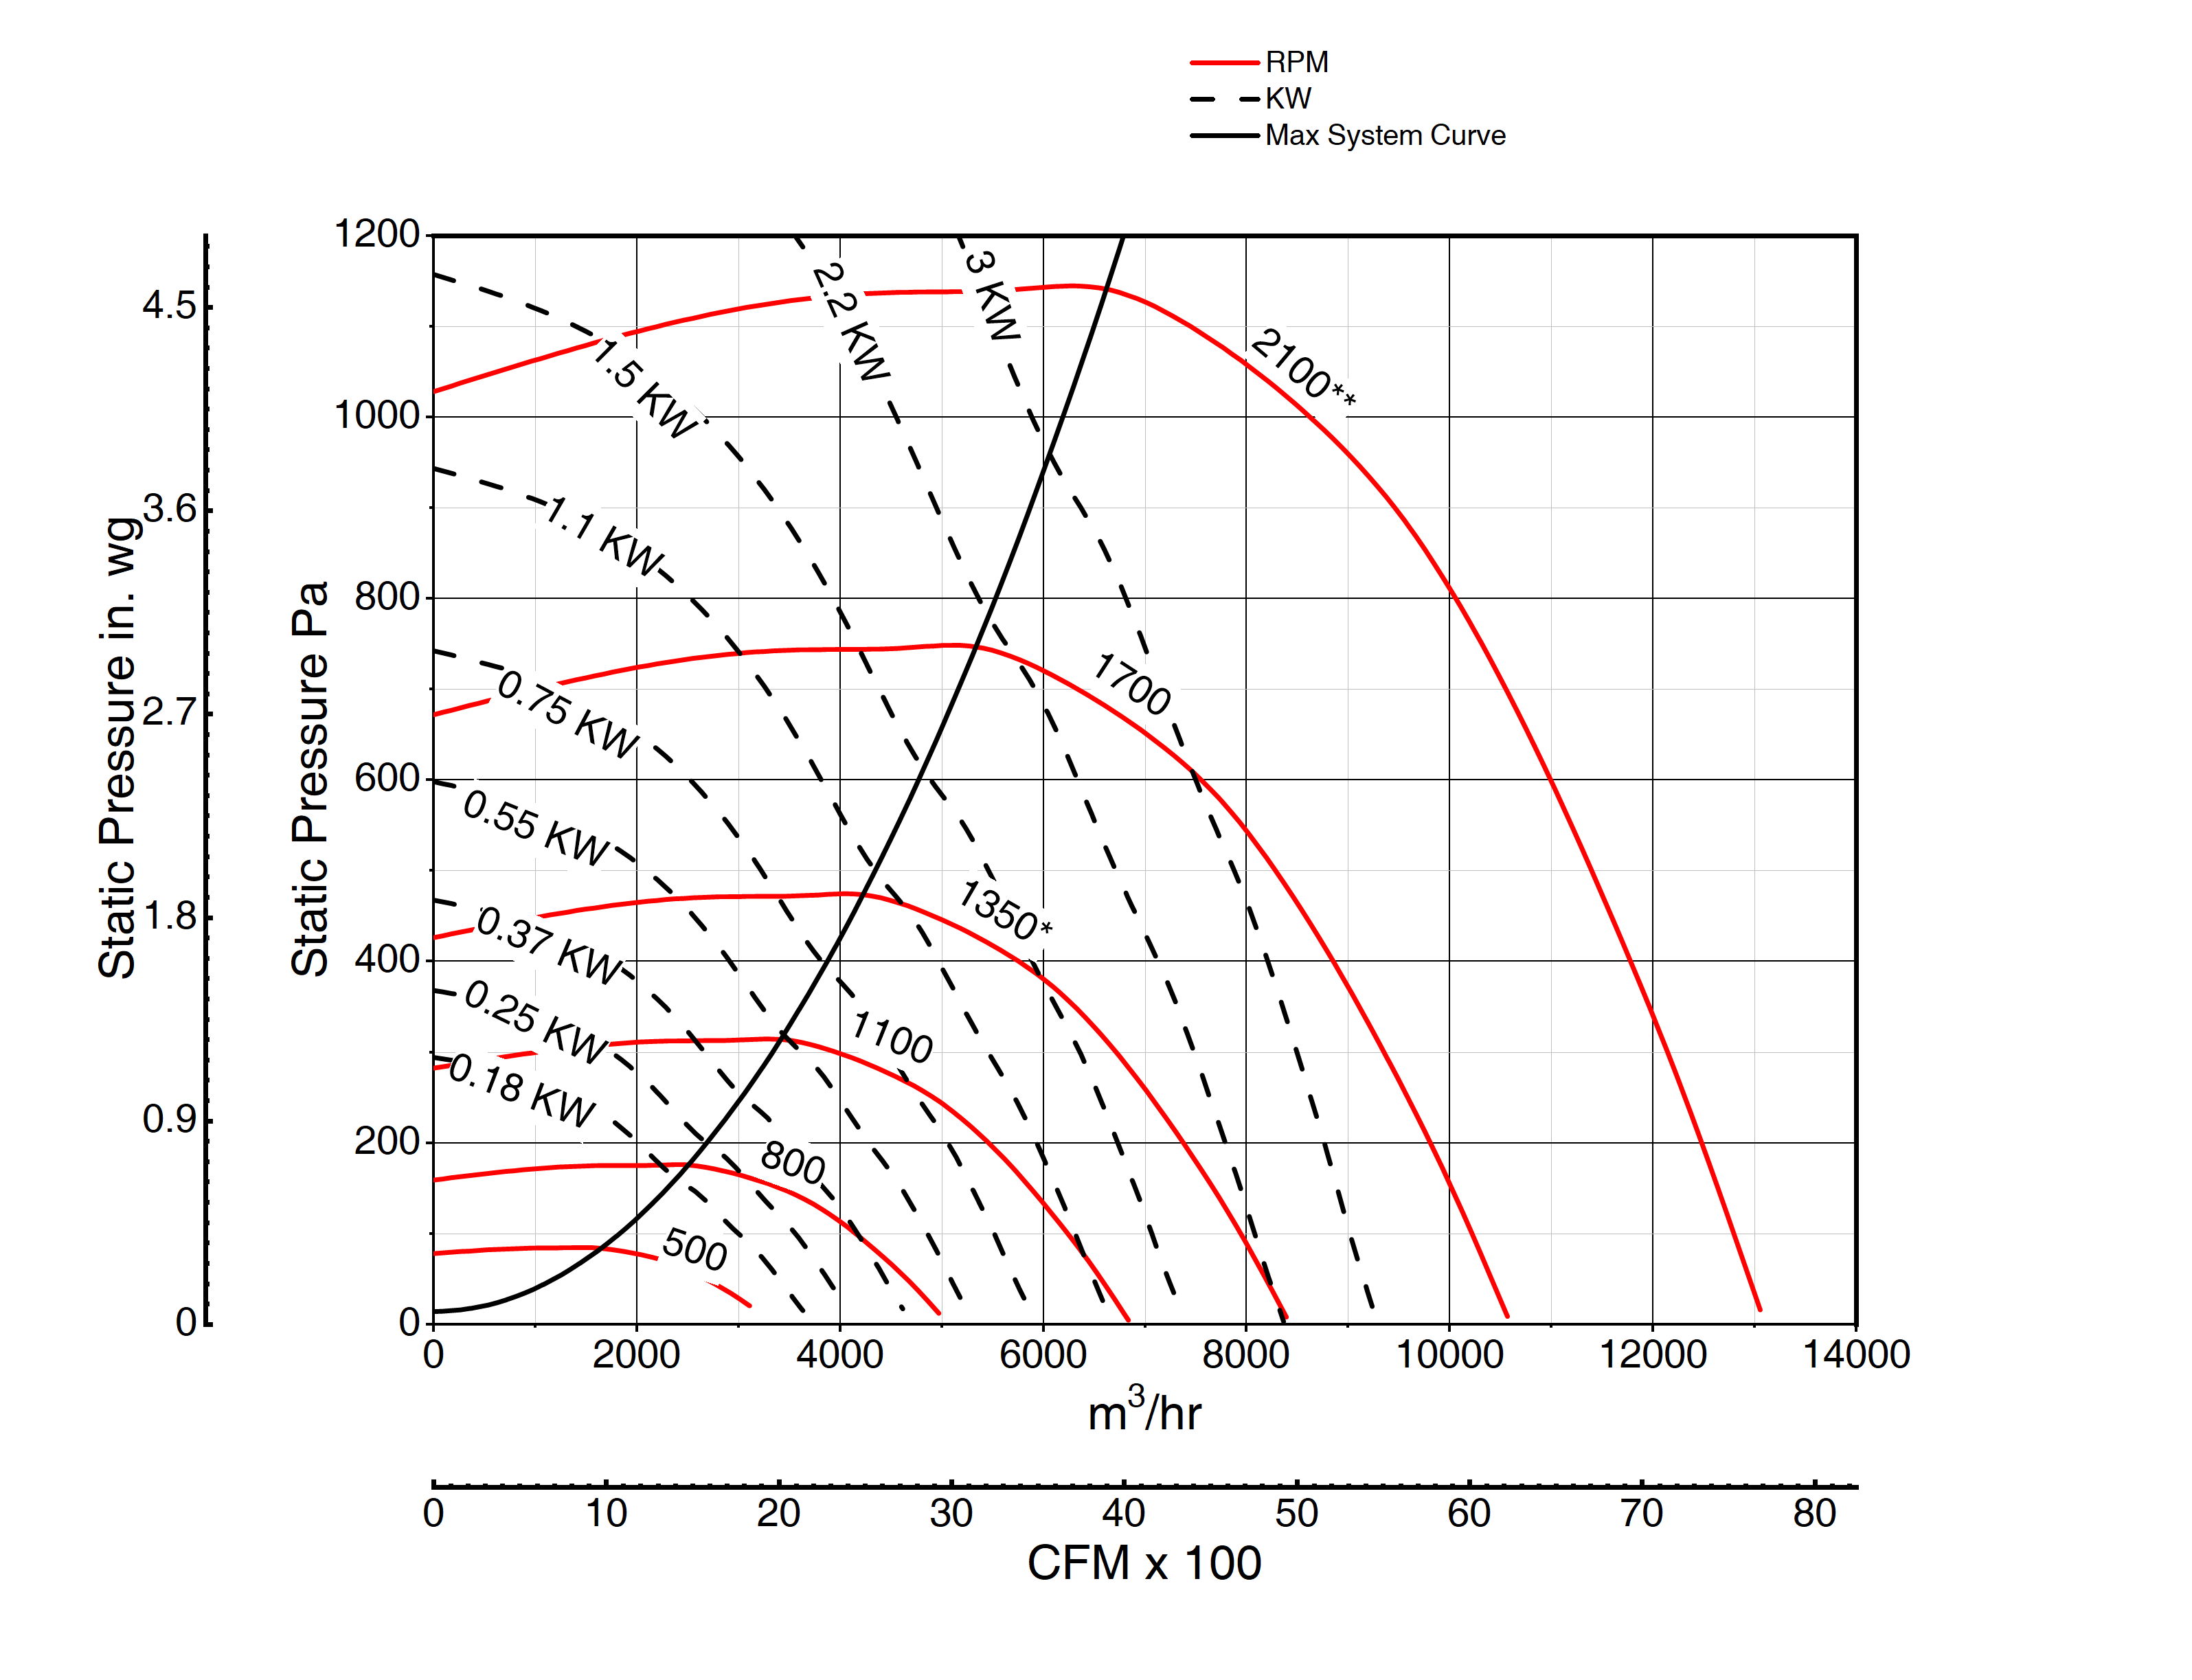
For reference, this type of chart is commonly known as a fan performance curve, fan characteristic curve, or simply fan curve.
1. Axes and Basic Layout
X‐Axis (Horizontal)
- Flow Rate: Shown in cubic meters per hour (m³/hr) along the top scale, and in cubic feet per minute (CFM) across the bottom scale. (You’ll see “CFM × 100” on the bottom axis.)
- As you move to the right on the x‐axis, the air volume (flow) increases.
Y‐Axis (Vertical)
- Static Pressure:
- The left label in inches water gauge (in. w.g.) (commonly used in some regions).
- The right label in Pascals (Pa) (SI unit).
- Higher up the y‐axis corresponds to a higher static pressure the fan can provide.
- Static Pressure:
Curves on the Plot
- Red Curves (RPM): Each red curve corresponds to a specific fan speed, in revolutions per minute. You’ll see labels like 500, 800, 1100, 1350, 1700, and 2100, etc.
- Dashed Curves (kW): These diagonal dashed lines represent the power consumption (in kW) at various operating points. For instance, 0.18 kW, 0.25 kW, 0.37 kW, and so on.
- Black Curve (Max System Curve): This is a system resistance curve (or sometimes simply a “system curve”). It shows how much pressure is required by the system at different flow rates.
2. How to Read the Fan Curves
Operating Points at Different RPM
- Each red curve (for a specific RPM) shows how the flow and pressure of the fan relate at that speed. For example:
- At 500 RPM, the fan might only produce a modest flow and static pressure.
- At 2100 RPM, you can achieve much higher flow, but also higher power usage and higher pressure capability.
- Each red curve (for a specific RPM) shows how the flow and pressure of the fan relate at that speed. For example:
Power Consumption (kW)
- The dashed lines (e.g., 0.18 kW, 0.37 kW, etc.) show approximate power draw at certain flow & pressure points. If you pick a point on a red RPM curve, you can see which dashed line it’s nearest to, giving you an estimate of the required motor power.
System Curve (Black Curve)
- A system curve tells you how much pressure is needed in the duct or system as flow changes. The black line labeled “Max System Curve” indicates the maximum pressure requirement that the system can impose.
- Where the fan curve (at a given RPM) intersects with this system curve is your fan’s operating point: the actual flow rate and pressure that will occur under those conditions.
3. Practical Usage
Fan Selection
- You typically select a fan by looking at the desired flow and pressure. For example, say your system needs 5000 m³/hr at 600 Pa. Find the intersection of 5000 m³/hr (on the x‐axis) and 600 Pa (on the y‐axis), then see which RPM curve meets that point.
- Ensure that the associated power consumption (kW) curve is within your motor’s rating.
Matching System and Fan
- If your actual system curve (black line) is steeper or higher than expected, you might end up with less flow than you hoped for, or you might need a higher RPM (and more powerful motor).
- If the system curve is flatter (less pressure drop), you might get more flow, but also need to check your fan’s power draw to avoid overloading the motor.
Performance Boundaries
- Each red RPM curve eventually slopes downward and to the right, which is typical: at higher flow rates, the fan cannot sustain as high a pressure.
- The maximum point on each curve (its “peak”) is often a best-efficiency region.
4. Key Takeaways
- Higher RPM → Higher Flow & Pressure but also higher kW.
- Dashed kW Curves help ensure motor power requirements are met.
- System Curve Intersection dictates the true operating point in a real‐world application.
- Static Pressure vs. Flow is the fundamental trade‐off in fan operation.
In short, this chart helps engineers pick the right fan speed (RPM) and motor power (kW) to achieve the desired flow and pressure for a system, ensuring the chosen fan will meet the performance requirements without overloading the motor.
Sources
- ASHRAE Handbook – Fundamentals (fan and duct system design principles)
- AMCA (Air Movement and Control Association) Publications
These organizations provide standards and guidelines commonly used for fan performance charts.